

Question: Need help with balance sheet at end. Additional information was posted on previous question ACME Distribution, Inc. Balance Sheet As of December 31, 2016 and
Need help with balance sheet at end. Additional information was posted on previous question
| ACME Distribution, Inc. | |||
| Balance Sheet | |||
| As of December 31, 2016 and 2015 | |||
| December 31, | |||
| 2016 | 2015 | ||
| Assets | |||
| Current assets | |||
| Cash | $ 34,620 | $ 34,620 | |
| Accounts receivable | 42,400 | 25,060 | |
| Allowance for bad debts | (1,908) | (1,200) | |
| Accounts receivable-net of allowance | 40,492 | 23,860 | |
| Inventory | 77,904 | 66,750 | |
| Supplies | |||
| Prepaid insurance | 15,200 | 10,700 | |
| Prepaid rent | 2,600 | 2,600 | |
| Total current assets | 136,196 | 138,530 | |
| Property, plant and equipment | |||
| Office equipment | 85,000 | 35,000 | |
| Warehouse equipment | 30,000 | 30,000 | |
| 65,000 | |||
| Less accumulated depreciation | -26,344 | 24,000 | |
| Net property, plant and equipment | 88,656 | 41,000 | |
| Total assets | $ 224,852 | $ 179,530 | |
| Liabilities | |||
| Current liabilities | |||
| Accounts payable | $ 14,550 | ||
| Salaries payable | 470 | ||
| Interest payable | 0 | ||
| Dividends payable | |||
| Unearned revenue | |||
| Total current liabilities | 15,020 | ||
| Long-term liability | |||
| Bond payable | 0 | ||
| Total liabilities | 15,020 | ||
| Stockholders' Equity | |||
| Common stock, $10 par value, 100,000 shares authorized, 170 and 120 shares issued and outstanding | 1,200 | ||
| Additional paid-in capital | 900 | ||
| Retained earnings | 162,410 | ||
| Total equity | 164,510 | ||
| Total liabilities and equity | $ 179,530 | ||
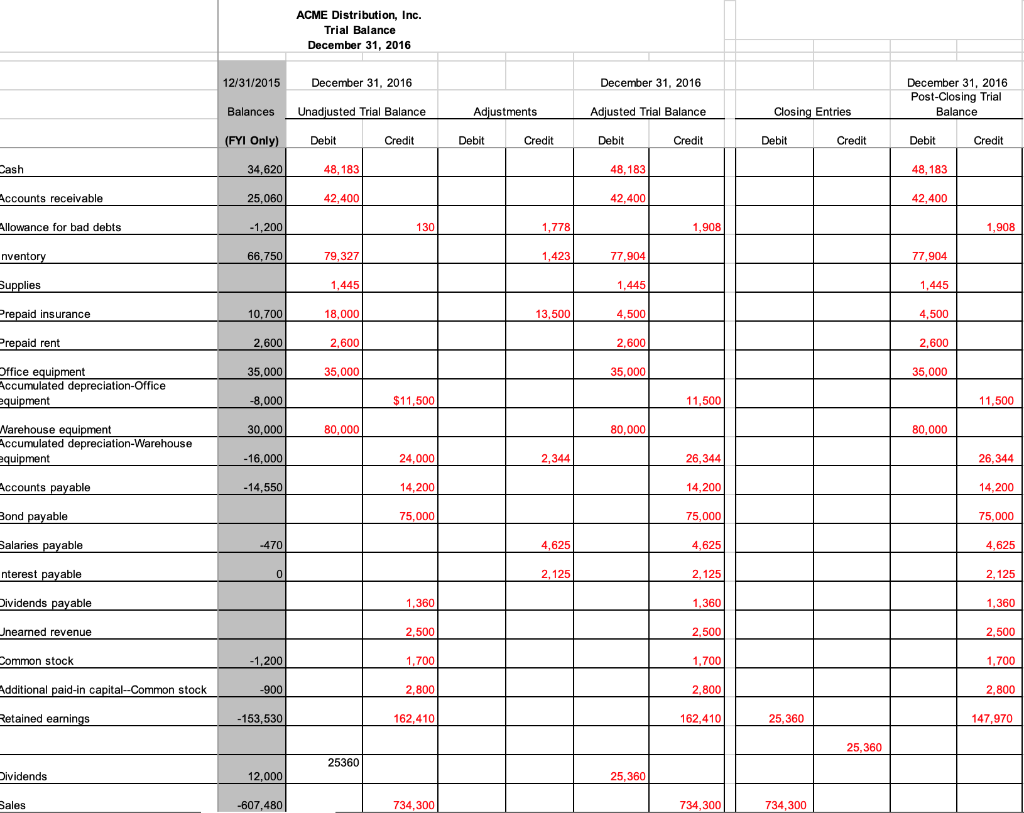
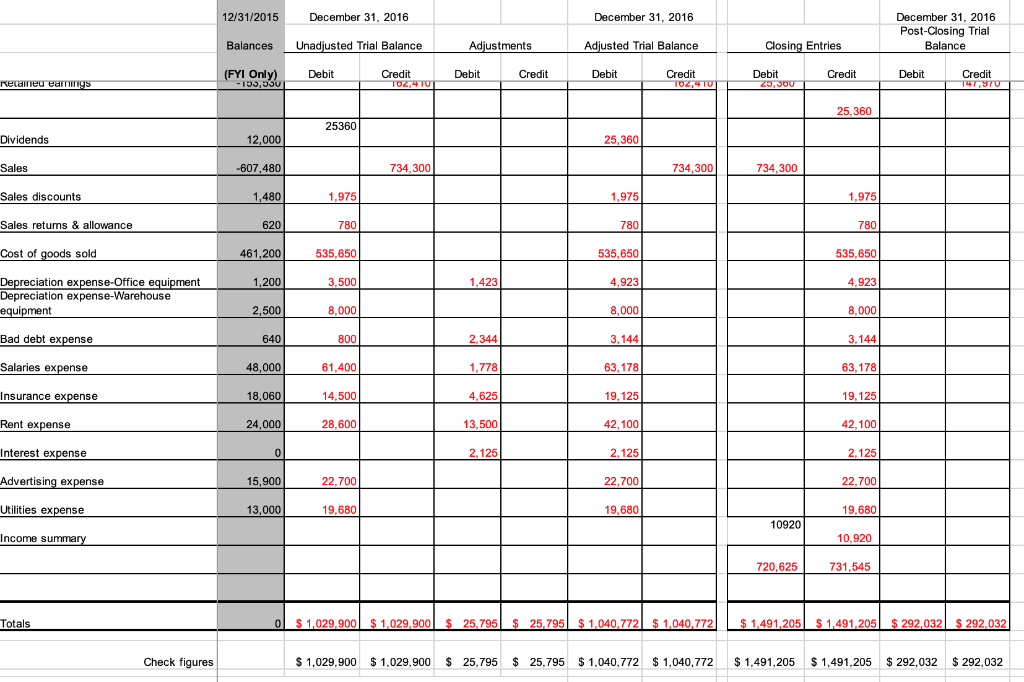
ACME Distribution, Inc. Trial Balance December 31, 2016 12/31/2015 December 31, 2016 December 31, 2016 December 31, 2016 Post-Closing Trial Balances Unadjusted Trial Balance Adjustments Adjusted Trial Balance Closing Entries Balance (FYI Only) Debit Credit Debit Credit Debit Credit Debit Credit Debit Credit Cash 34,620 48,183 48,183 48,183 Accounts receivable 25,060 42,400 42.400 42,400 Allowance for bad debts -1,200 130 1,778 1,908 1,908 nventory 66,750 79,327 1,423 77,904 77,904 Supplies 1,445 1,445 1,445 Prepaid insurance 10,700 18,0001 13,500 4,500 4,500 Prepaid rent 2,600 2,600 2,600 2,600 35,000 35,000 35,000 35,000 Office equipment Accumulated depreciation Office equipment -8,000 $11,500 11,500 11,500 30,000 80,000 80,000 80,000 Narehouse equipment Accumulated depreciation-Warehouse equipment - 16,000 24,000 2,344 26,344 26,344 Accounts payable - 14,550 14,200 14.200 14,200 Bond payable 75,000 75,000 75,000 Salaries payable -470 4.625 4,625 4,625 nterest payable 0 0 2,125 2,125 2,125 Dividends payable 1,360 1,360 1,360 Unearned revenue 2,500 2,500 2,500 Common stock -1,200 1,700 1,700 1,700 Additional paid-in capital--Common stock -900 2,800 2,800 2,800 Retained earnings -153,530 162,410 162,410 25,360 147,970 25,360 25360 Dividends 12,000 25,360 Sales -607,480 734,300 734,300 734,300 12/31/2015 December 31, 2016 December 31, 2016 December 31, 2016 Post-Closing Trial Balance Balances Unadjusted Trial Balance Adjustments Adjusted Trial Balance Closing Entries Debit Debit Credit Debit Credit (FYI Only) - 199,330 Reramea earnings Credit TOZ,4 TO Credit TUZ, TUT Debit 29, 300 Debit Credit 747,970 25,360 25360 Dividends 12,000 25,360 Sales -607,480 734,300 734,300 734,300 Sales discounts 1,480 1,975 1.975 1,975 Sales returns & allowance 620 780 780 780 Cost of goods sold 461,200 535.650 535,650 535,650 1,200 3,500 1,423 4,923 4,923 Depreciation expense-Office equipment Depreciation expense-Warehouse equipment 2,500 8.000 8.000 8,000 Bad debt expense 640 800 2,344 3,144 3,144 Salaries expense 48,000 61,400 1,778 63. 178 63,178 Insurance expense 18,060 14,500 4,625 19, 125 19,125 Rent expense 24,000 28,600 13,500 42,100 42,100 Interest expense 0 2, 125 2,125 2.125 Advertising expense 15,900 22,700 22.700 22,700 Utilities expense 13,000 19,680 19,680 19,680 10920 Income summary 10,920 720,625 731,545 Totals 0 $ 1,029,900 $ 1,029,900 $ 25,795 $ 25,795 $ 1.040,772 $ 1.040,772 A $ $ 1,491,205 $ 1,491,205 $ 292,032 $ 292,032 Check figures $ 1,029,900 $ 1,029,900 $ 25,795 $ 25,795 $ 1,040,772 $ 1,040,772 $ 1,491,205 $ 1,491,205 $ 292,032 $ 292,032 ACME Distribution, Inc. Trial Balance December 31, 2016 12/31/2015 December 31, 2016 December 31, 2016 December 31, 2016 Post-Closing Trial Balances Unadjusted Trial Balance Adjustments Adjusted Trial Balance Closing Entries Balance (FYI Only) Debit Credit Debit Credit Debit Credit Debit Credit Debit Credit Cash 34,620 48,183 48,183 48,183 Accounts receivable 25,060 42,400 42.400 42,400 Allowance for bad debts -1,200 130 1,778 1,908 1,908 nventory 66,750 79,327 1,423 77,904 77,904 Supplies 1,445 1,445 1,445 Prepaid insurance 10,700 18,0001 13,500 4,500 4,500 Prepaid rent 2,600 2,600 2,600 2,600 35,000 35,000 35,000 35,000 Office equipment Accumulated depreciation Office equipment -8,000 $11,500 11,500 11,500 30,000 80,000 80,000 80,000 Narehouse equipment Accumulated depreciation-Warehouse equipment - 16,000 24,000 2,344 26,344 26,344 Accounts payable - 14,550 14,200 14.200 14,200 Bond payable 75,000 75,000 75,000 Salaries payable -470 4.625 4,625 4,625 nterest payable 0 0 2,125 2,125 2,125 Dividends payable 1,360 1,360 1,360 Unearned revenue 2,500 2,500 2,500 Common stock -1,200 1,700 1,700 1,700 Additional paid-in capital--Common stock -900 2,800 2,800 2,800 Retained earnings -153,530 162,410 162,410 25,360 147,970 25,360 25360 Dividends 12,000 25,360 Sales -607,480 734,300 734,300 734,300 12/31/2015 December 31, 2016 December 31, 2016 December 31, 2016 Post-Closing Trial Balance Balances Unadjusted Trial Balance Adjustments Adjusted Trial Balance Closing Entries Debit Debit Credit Debit Credit (FYI Only) - 199,330 Reramea earnings Credit TOZ,4 TO Credit TUZ, TUT Debit 29, 300 Debit Credit 747,970 25,360 25360 Dividends 12,000 25,360 Sales -607,480 734,300 734,300 734,300 Sales discounts 1,480 1,975 1.975 1,975 Sales returns & allowance 620 780 780 780 Cost of goods sold 461,200 535.650 535,650 535,650 1,200 3,500 1,423 4,923 4,923 Depreciation expense-Office equipment Depreciation expense-Warehouse equipment 2,500 8.000 8.000 8,000 Bad debt expense 640 800 2,344 3,144 3,144 Salaries expense 48,000 61,400 1,778 63. 178 63,178 Insurance expense 18,060 14,500 4,625 19, 125 19,125 Rent expense 24,000 28,600 13,500 42,100 42,100 Interest expense 0 2, 125 2,125 2.125 Advertising expense 15,900 22,700 22.700 22,700 Utilities expense 13,000 19,680 19,680 19,680 10920 Income summary 10,920 720,625 731,545 Totals 0 $ 1,029,900 $ 1,029,900 $ 25,795 $ 25,795 $ 1.040,772 $ 1.040,772 A $ $ 1,491,205 $ 1,491,205 $ 292,032 $ 292,032 Check figures $ 1,029,900 $ 1,029,900 $ 25,795 $ 25,795 $ 1,040,772 $ 1,040,772 $ 1,491,205 $ 1,491,205 $ 292,032 $ 292,032
Step by Step Solution
There are 3 Steps involved in it

Get step-by-step solutions from verified subject matter experts