Question: Need help with CapSim simulation competition . Below is the most recent report. Team ERIE is the one I need advice on because our position
Need help with CapSim simulation competition. Below is the most recent report. Team ERIE is the one I need advice on because our position is horrible and we're so lost. We are currently in Round 6. Help...
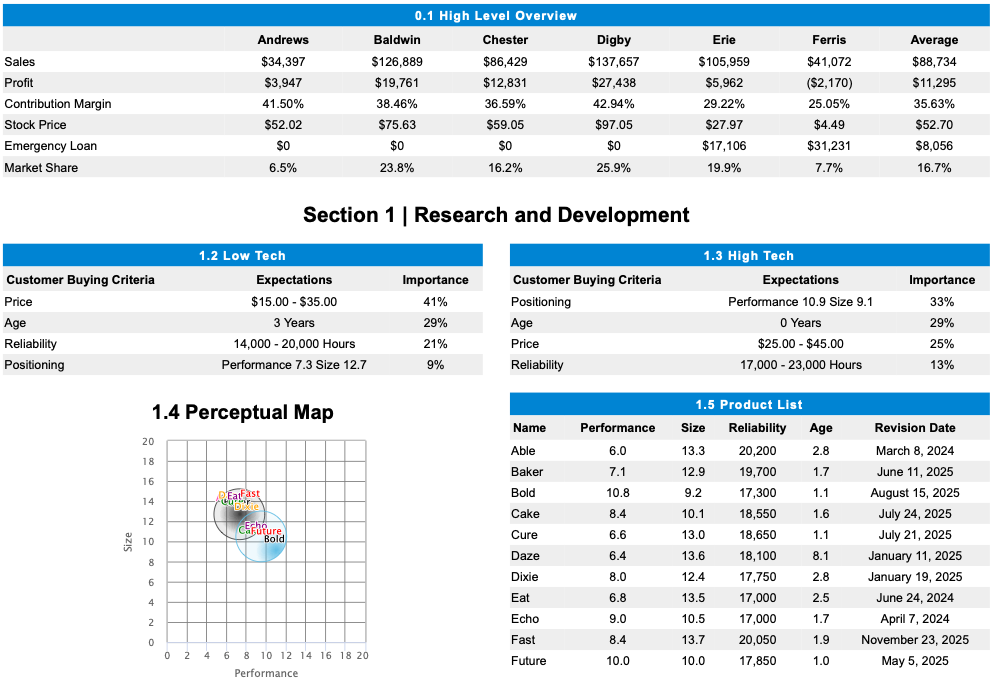
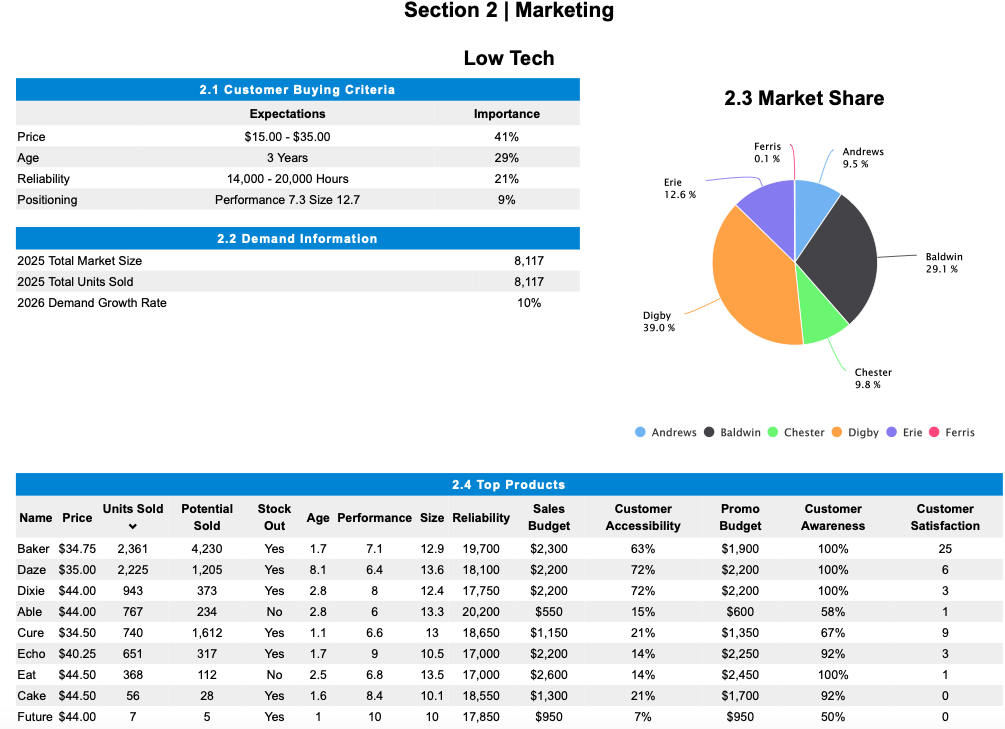
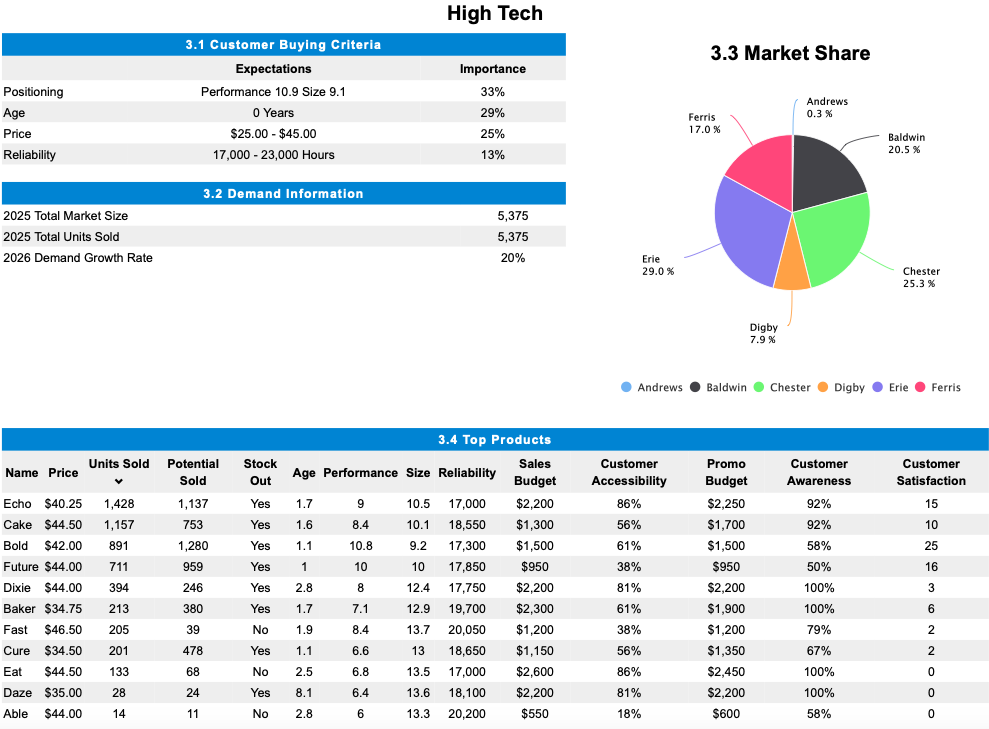
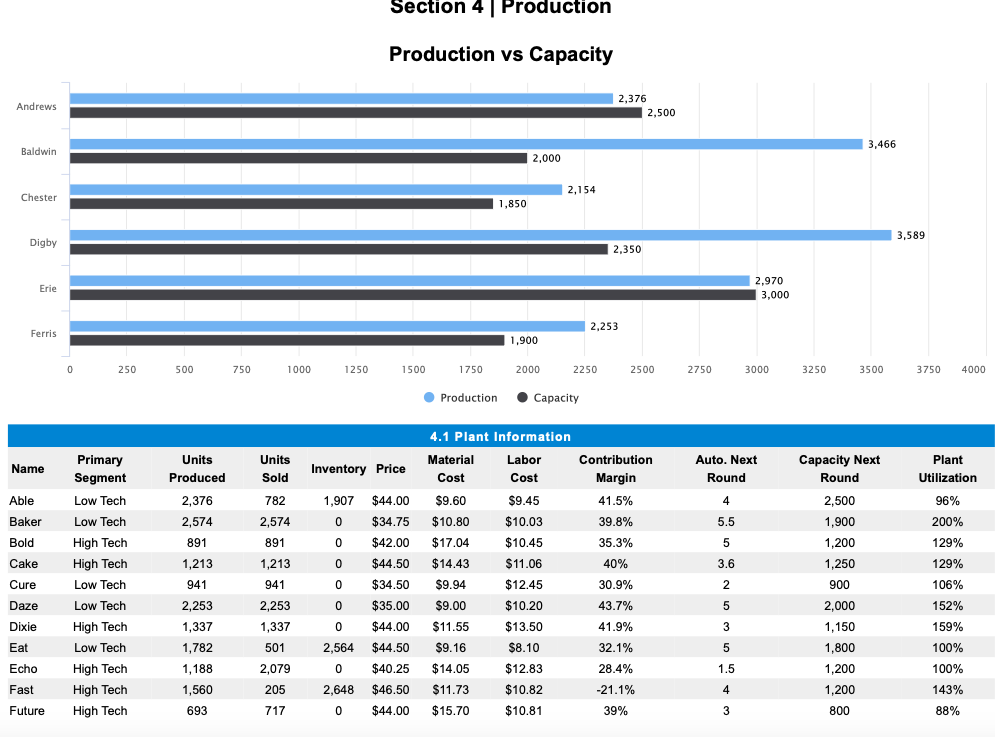
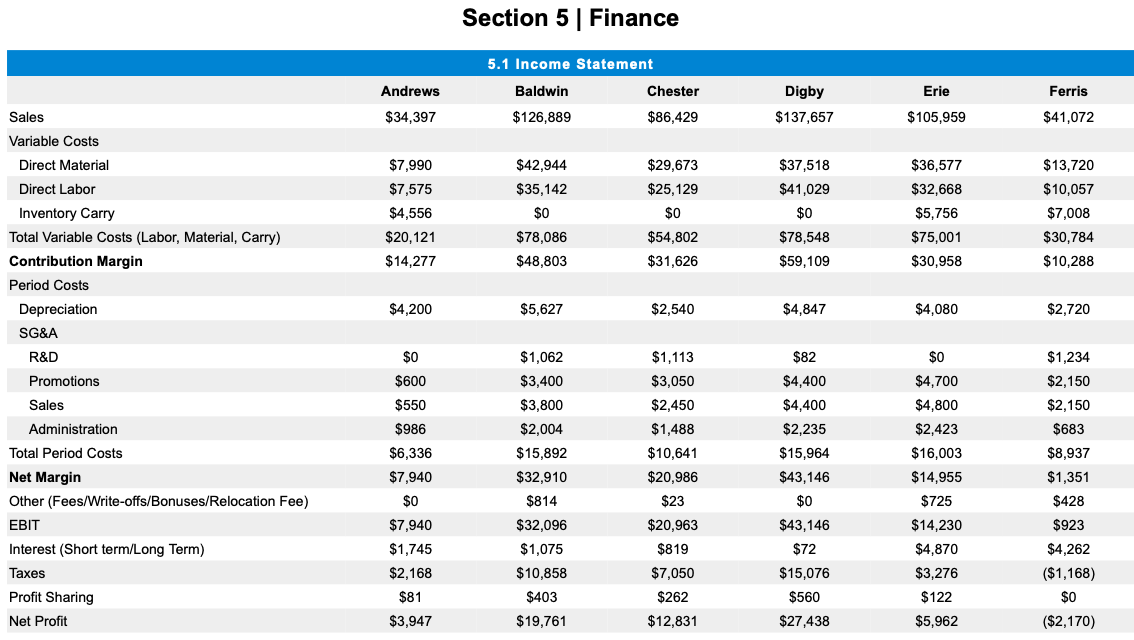
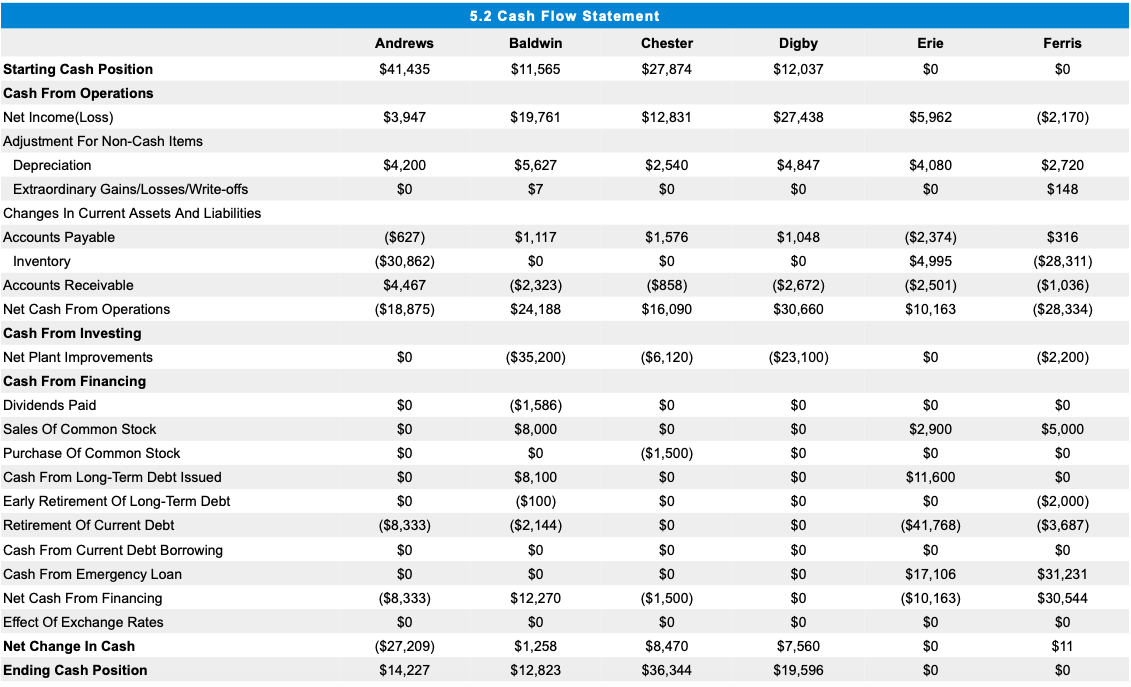
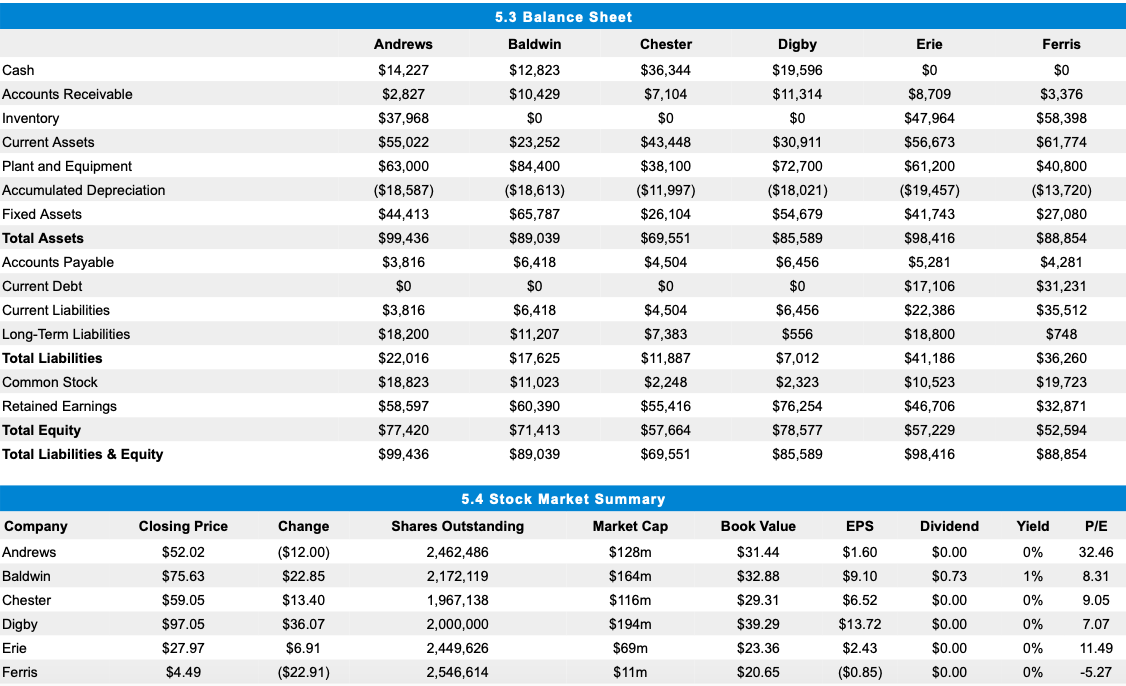
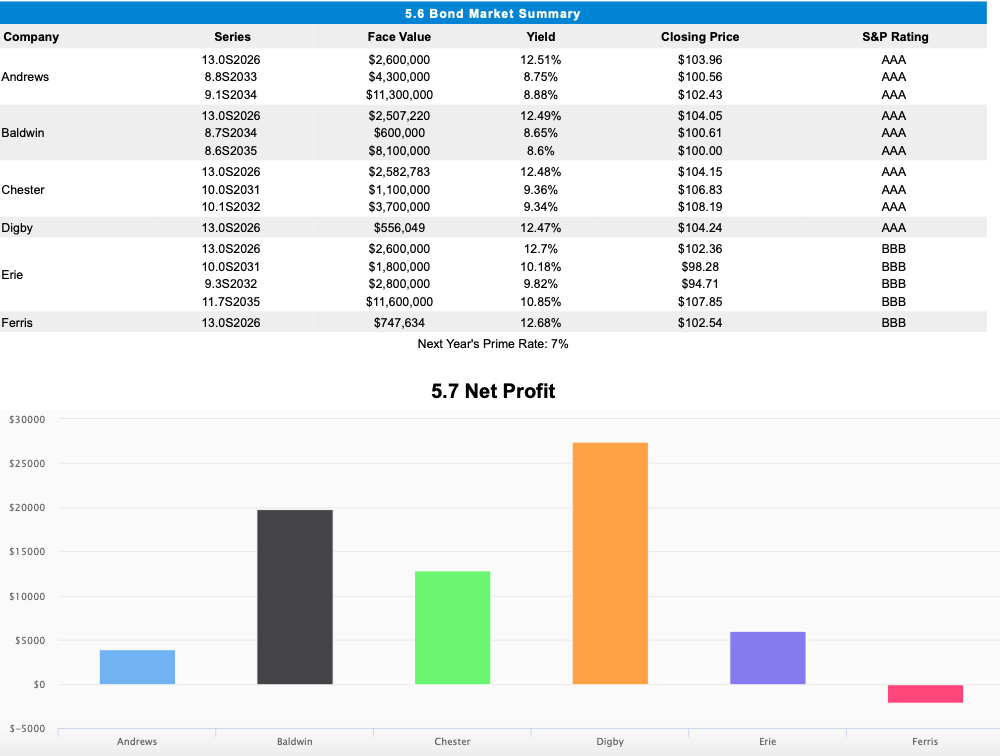
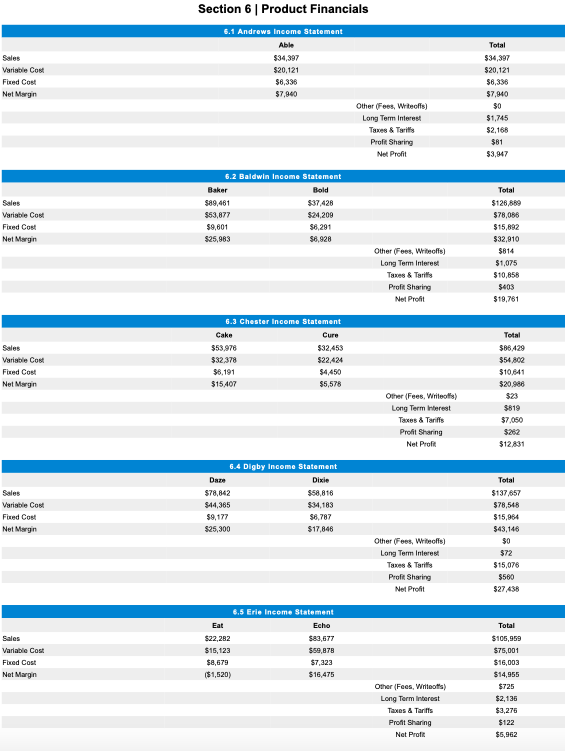
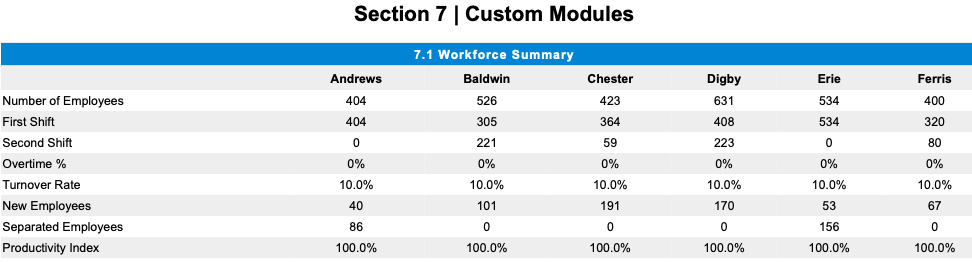
Erie Ferris Sales Profit Contribution Margin Stock Price Emergency Loan Market Share Andrews $34,397 $3,947 41.50% $52.02 0.1 High Level Overview Baldwin Chester $126,889 $86,429 $19,761 $12,831 38.46% 36.59% $75.63 $59.05 $0 $0 23.8% 16.2% Digby $137,657 $27,438 42.94% $97.05 $0 25.9% $105,959 $5,962 29.22% $27.97 $17,106 19.9% $41,072 ($2,170) 25.05% $4.49 Average $88,734 $11,295 35.63% $52.70 $8,056 16.7% $0 $31,231 6.5% 7.7% Section 1 Research and Development 1.3 High Tech Expectations Performance 10.9 Size 9.1 Importance 33% Customer Buying Criteria Price Age Reliability Positioning 1.2 Low Tech Expectations $15.00 - $35.00 3 Years 14,000 - 20,000 Hours Performance 7.3 Size 12.7 Importance 41% 29% 21% 9% Customer Buying Criteria Positioning Age Price Reliability 0 Years 29% 25% $25.00 - $45.00 17,000 - 23,000 Hours 13% 1.4 Perceptual Map Name Performance Revision Date 20 18 6.0 7.1 10.8 16 14 D'EatFast Curr De Able Baker Bold Cake Cure Daze Dixie 8.4 12 cafuture Echo Bold 6.6 1.5 Product List Size Reliability Age 13.3 20,200 2.8 12.9 19,700 1.7 9.2 17,300 1.1 10.1 18,550 1.6 13.0 18,650 1.1 13.6 18,100 8.1 12.4 17,750 2.8 13.5 17,000 2.5 10.5 17,000 1.7 13.7 20,050 1.9 10.0 17,850 1.0 10 6.4 March 8, 2024 June 11, 2025 August 15, 2025 July 24, 2025 July 21, 2025 January 11, 2025 January 19, 2025 June 24, 2024 April 7, 2024 November 23, 2025 May 5, 2025 8 8.0 6 4 Eat 6.8 Echo 9.0 2 0 Fast 8.4 0 2 4 6 8 10 12 14 16 18 20 Performance Future 10.0 Section 2 | Marketing Low Tech 2.3 Market Share Importance Price 2.1 Customer Buying Criteria Expectations $15.00 - $35.00 3 Years 14,000 - 20,000 Hours Performance 7.3 Size 12.7 41% 29% Ferris 0.1% Andrews 9.5% Age Reliability Positioning 21% Erie 12.6% 9% 2.2 Demand Information 2025 Total Market Size Baldwin 29.1 % 2025 Total Units Sold 2026 Demand Growth Rate 8,117 8,117 10% Digby 39.0 % Chester 9.8 % Andrews Baldwin Chester Digby Erie Ferris Units Sold Name Price Stock Out V Customer Accessibility 63% Customer Satisfaction Potential Sold 4,230 1,205 373 Customer Awareness 100% Yes Baker $34.75 Daze $35.00 Promo Budget $1,900 $2,200 $2,200 2,361 2,225 25 Yes 72% 100% 6 943 Yes 3 Dixie $44.00 Able $44.00 2.4 Top Products Sales Age Performance Size Reliability Budget 1.7 7.1 12.9 19,700 $2,300 8.1 6.4 13.6 18,100 $2,200 2.8 8 12.4 17,750 $2,200 2.8 6 13.3 20,200 $550 1.1 6.6 13 18,650 $1,150 1.7 9 10.5 17,000 $2,200 2.5 6.8 13.5 17,000 $2,600 1.6 8.4 10.1 18,550 $1,300 1 10 10 17,850 $950 72% 15% 767 234 No $600 1 100% 58% 67% 92% 740 Yes 21% 9 Cure $34.50 Echo $40.25 Eat $44.50 651 1,612 317 112 Yes 3 14% 14% $1,350 $2,250 $2,450 $1,700 368 No 100% 1 Cake $44.50 56 28 Yes 21% 0 92% 50% Future $44.00 7 5 Yes 7% $950 0 High Tech 3.3 Market Share 3.1 Customer Buying Criteria Expectations Performance 10.9 Size 9.1 0 Years $25.00 - $45.00 17,000 -23,000 Hours Importance 33% 29% Andrews Positioning Age Price Reliability 0.3% Ferris 17.0% 25% Baldwin 20.5% 13% 3.2 Demand Information 2025 Total Market Size 2025 Total Units Sold 2026 Demand Growth Rate 5,375 5,375 20% Erie 29.0% Chester 25.3% Digby 7.9 % Andrews Baldwin Chester Digby Erie Ferris Units Sold Name Price Potential Sold Stock Out Customer Accessibility 86% Customer Awareness Customer Satisfaction V 1,428 1,137 Yes 15 Echo $40.25 Cake $44.50 Bold $42.00 92% 92% 753 Yes 56% 10 1,157 891 Yes 58% 25 1,280 959 61% 38% 711 Yes 50% 16 3.4 Top Products Sales Age Performance Size Reliability Budget 1.7 9 10.5 17,000 $2,200 1.6 8.4 10.1 18,550 $1,300 1.1 10.8 9.2 17,300 $1,500 1 10 10 17,850 $950 2.8 8 12.4 17,750 $2,200 1.7 7.1 12.9 19,700 $2,300 1.9 8.4 13.7 20,050 $1,200 1.1 6.6 13 18,650 $1,150 2.5 6.8 13.5 17,000 $2,600 8.1 6.4 13.6 18,100 $2,200 2.8 6 13.3 20,200 $550 394 246 Yes 81% Promo Budget $2,250 $1,700 $1,500 $950 $2,200 $1,900 $1,200 $1,350 $2,450 $2,200 $600 100% 3 213 380 Yes 61% 100% 6 205 39 No Future $44.00 Dixie $44.00 Baker $34.75 Fast $46.50 Cure $34.50 Eat $44.50 Daze $35.00 Able $44.00 79% 2 478 Yes 38% 56% 86% 201 133 2 67% 100% 68 No 0 28 24 Yes 81% 0 100% 58% 14 11 No 18% 0 Section 4 Production Production vs Capacity Andrews 2,376 2,500 3,466 Baldwin 2,000 2,154 Chester | 1,850 3,589 Digby 2,350 Erie 2,970 3,000 2,253 Ferris 1,900 0 250 500 750 1000 1250 1500 1750 2000 2250 2500 2750 3000 3250 3500 3750 4000 Production Capacity 4.1 Plant Information Name Units Sold Inventory Price Material Cost Labor Cost Auto. Next Round Plant Utilization Units Produced 2,376 2,574 Able 4 96% 782 2,574 Baker $9.60 $10.80 $17.04 $9.45 $10.03 $10.45 1,907 $44.00 0 $34.75 0 $42.00 0 $44.50 5.5 200% Bold 891 891 Contribution Margin 41.5% 39.8% 35.3% 40% 30.9% 43.7% 41.9% 5 129% Cake 1,213 1,213 $11.06 3.6 129% Primary Segment Low Tech Low Tech High Tech High Tech Low Tech Low Tech High Tech Low Tech High Tech High Tech High Tech Cure Capacity Next Round 2,500 1,900 1,200 1,250 900 2,000 1,150 1,800 1,200 1,200 941 941 0 2 106% $14.43 $9.94 $9.00 $11.55 0 Daze Dixie $34.50 $35.00 $44.00 2,253 1,337 5 2,253 1,337 $12.45 $10.20 $13.50 152% 159% 0 3 Eat 501 2,564 $44.50 $9.16 $8.10 32.1% 5 100% 1,782 1,188 1,560 0 $14.05 1.5 Echo Fast Future 100% 2,079 205 717 $40.25 $46.50 $44.00 $12.83 $10.82 28.4% -21.1% 2,648 $11.73 4 143% 693 0 $15.70 $10.81 39% 3 800 88% Section 5 | Finance 5.1 Income Statement Andrews Baldwin Chester Erie Ferris Digby $137,657 Sales $34,397 $126,889 $86,429 $105,959 $41,072 Variable Costs Direct Material Direct Labor $37,518 $42,944 $35,142 $29,673 $25,129 $7,990 $7,575 $4,556 $20,121 $14,277 $41,029 $0 $0 $36,577 $32,668 $5,756 $75,001 $30,958 $0 $54,802 $31,626 $13,720 $10,057 $7,008 $30,784 $10,288 $78,086 $48,803 $78,548 $59,109 Inventory Carry Total Variable Costs (Labor, Material, Carry) Contribution Margin Period Costs Depreciation SG&A $4,200 $5,627 $2,540 $4,847 $4,080 $2,720 R&D $0 $0 $1,234 $600 $4,700 $2,150 Promotions Sales $550 $1,062 $3,400 $3,800 $2,004 $15,892 $32,910 $986 Administration Total Period Costs Net Margin Other (Fees/Write-offs/Bonuses/Relocation Fee) EBIT Interest (Short term/Long Term) Taxes Profit Sharing Net Profit $1,113 $3,050 $2,450 $1,488 $10,641 $20,986 $23 $20,963 $819 $7,050 $262 $12,831 $82 $4,400 $4,400 $2,235 $15,964 $43,146 $0 $43,146 $814 $6,336 $7,940 $0 $7,940 $1,745 $2,168 $81 $3,947 $4,800 $2,423 $16,003 $14,955 $725 $14,230 $4,870 $3,276 $122 $5,962 $2,150 $683 $8,937 $1,351 $428 $923 $4,262 ($1,168) $0 ($2,170) $32,096 $1,075 $10,858 $72 $15,076 $560 $403 $19,761 $27,438 5.2 Cash Flow Statement Andrews Baldwin Chester Erie Ferris Digby $12,037 $41,435 $11,565 $27,874 $0 $0 $3,947 $19,761 $12,831 $27,438 $5,962 ($2,170) $4,200 $2,540 $4,847 $5,627 $7 $4,080 $0 $2,720 $148 $0 $0 $0 ($627) $1,117 $1,048 $0 ($30,862) $4,467 ($18,875) $1,576 $0 ($858) $16,090 ($2,374) $4,995 ($2,501) $10,163 $0 ($2,672) $30,660 $316 ($28,311) ($1,036) ($28,334) ($2,323) $24,188 $0 ($35,200) ($6,120) ($23,100) $0 ($2,200) Starting Cash Position Cash From Operations Net Income(Loss) Adjustment For Non-Cash Items Depreciation Extraordinary Gains/Losses/Write-offs Changes in Current Assets And Liabilities Accounts Payable Inventory Accounts Receivable Net Cash From Operations Cash From Investing Net Plant Improvements Cash From Financing Dividends Paid Sales Of Common Stock Purchase Of Common Stock Cash From Long-Term Debt Issued Early Retirement of Long-Term Debt Retirement of Current Debt Cash From Current Debt Borrowing Cash From Emergency Loan Net Cash From Financing Effect Of Exchange Rates Net Change In Cash Ending Cash Position $0 $0 $0 $0 $0 $2,900 $0 $0 $5,000 $0 $0 $0 $0 ($1,586) $8,000 $0 $8,100 ($100) ($2,144) $0 $0 ($1,500) $0 $0 $0 $0 $0 $11,600 $0 $0 ($8,333) $0 $0 $0 ($2,000) ($3,687) $0 ($41,768) $0 $0 $0 $0 $0 $0 $0 $0 $31,231 $30,544 $12,270 $0 $17,106 ($10,163) $0 ($8,333) $0 $0 $0 $0 ($1,500) $0 $8,470 $36,344 $1,258 $7,560 $0 $11 ($27,209) $14,227 $12,823 $19,596 $0 $0 5.3 Balance Sheet Andrews Baldwin Chester Erie Ferris Cash $12,823 $10,429 $0 $0 Digby $19,596 $11,314 $36,344 $7,104 $0 $0 $43,448 Accounts Receivable Inventory Current Assets Plant and Equipment Accumulated Depreciation Fixed Assets Total Assets Accounts Payable Current Debt Current Liabilities Long-Term Liabilities Total Liabilities Common Stock Retained Earnings Total Equity Total Liabilities & Equity $14,227 $2,827 $37,968 $55,022 $63,000 ($18,587) $44,413 $99,436 $3,816 $0 $3,816 $18,200 $22,016 $18,823 $58,597 $77,420 $99,436 $23,252 $84,400 ($18,613) $65,787 $89,039 $6,418 $0 $30,911 $72,700 ($18,021) $54,679 $85,589 $6,456 $0 $6,456 $556 $7,012 $2,323 $76,254 $78,577 $85,589 $38,100 ($11,997) $26,104 $69,551 $4,504 $0 $4,504 $7,383 $11,887 $2,248 $55,416 $57,664 $69,551 $0 $8,709 $47,964 $56,673 $61,200 ($19,457) $41,743 $98,416 $5,281 $17,106 $22,386 $18,800 $41,186 $10,523 $46,706 $57,229 $98,416 $3,376 $58,398 $61,774 $40,800 ($13,720) $27,080 $88,854 $4,281 $31,231 $35,512 $748 $6,418 $11,207 $17,625 $11,023 $60,390 $71,413 $89,039 $36,260 $19,723 $32,871 $52,594 $88,854 Company Book Value EPS Dividend Yield P/E $0.00 32.46 Andrews Baldwin Closing Price $52.02 $75.63 $59.05 $97.05 $27.97 $4.49 Change ($12.00) $22.85 $13.40 5.4 Stock Market Summary Shares Outstanding Market Cap 2,462,486 $128m 2,172,119 $164m 1,967,138 $116m 2,000,000 $194m 2,449,626 $69m 2,546,614 $11m $0.73 $0.00 8.31 9.05 Chester $31.44 $32.88 $29.31 $39.29 $23.36 $20.65 $1.60 $9.10 $6.52 $13.72 $2.43 ($0.85) 0% 1% 0% 0% 0% 0% $36.07 Digby Erie Ferris $0.00 $0.00 7.07 11.49 $6.91 ($22.91) $0.00 -5.27 Company Series S&P Rating Andrews 13.0S2026 8.8S2033 9.1S2034 AAA AAA Baldwin AAA AAA AAA 13.0S2026 8.7S2034 8.6S2035 13.0S2026 10.082031 10.1 S2032 5.6 Bond Market Summary Face Value Yield $2,600,000 12.51% $4,300,000 8.75% $11,300,000 8.88% $2,507,220 12.49% $600,000 8.65% $8,100,000 8.6% $2,582,783 12.48% $1,100,000 9.36% $3,700,000 9.34% $556,049 12.47% $2,600,000 12.7% $1,800,000 10.18% $2,800,000 9.82% $11,600,000 10.85% $747,634 12.68% Next Year's Prime Rate: 7% Closing Price $103.96 $100.56 $102.43 $104.05 $100.61 $100.00 $104.15 $106.83 $108.19 $104.24 $102.36 $98.28 $94.71 $107.85 $102.54 Chester AAA AAA AAA Digby 13.0S2026 13.0S2026 10.082031 9.352032 11.752035 13.0S2026 AAA BBB BBB BBB BBB Erie Ferris BBB 5.7 Net Profit $30000 $25000 $20000 $15000 $10000 $5000 $0 $-5000 Andrews Baldwin Chester Digby Erie Ferris Section 6 Product Financials Sales Variable Con Fixed Cost Net Margin 6.1 Andrews Income Statement A, $34,397 $20,121 $6,336 $7,940 Total $34,397 $20,121 $6,336 $7.940 $0 $1,745 $2,168 $81 $3,947 Other (Fees, Writeoffs) Long Term Interest Profit Sharing Net Profit Sales Variable Con Fixed Cost Nel Margin 6.2 Baldwin Income Statement Baker Bold $89,461 $37,428 $53,877 $2,209 $9,601 $8,291 $25,983 $6,928 Total $128 80 $78,086 $15,892 $32,910 $814 $1,075 $10,858 $403 $19,761 Other (Fees, Writeoffs) Long Term interest Taxes & Tariffs Profit Sharing Net Profit Cure Sales Variable Cost Fixed Cost Net Margin 6.3 Chester Income Statement Cake $53,978 $32,453 $32,378 $22,424 56,191 $4,450 $15407 $5,578 Total $86.429 $54802 $10.641 $20.986 $23 $819 57,050 $282 $12831 Other (Fees, Writeollis) Long Term rest Taxes & Tariffs Profit Sharing Net Profit DO Sales Variable Cou Fixed Cost Net Margin 6.4 Digby Income Statement Dixie $78,842 $58,816 $14,365 $34,183 $9,177 $6,787 $25,300 $17,846 Total $137.657 $78,548 $15,964 $43,146 $0 $72 $15,076 $580 $27,438 Other (Fees, Writeoffs) Long Term Interest Taxes & Tarifs Profit Sharing Net Profil Total Sales Variable Cost Fkred Cost Net Margin 6.5 Erie Income Statement Eat Echo $22,282 $83,677 $15,123 $59,878 $8,679 $7,323 ($1,520) $16,475 $106,959 $75,001 $16,003 $14,955 $725 Other (Fees, Writeos) Long Term Interest Taxes & Tariffs Profit Sharing Net Profi $2,136 $3,276 $122 $5,962 Section 7 Custom Modules Andrews 404 7.1 Workforce Summary Baldwin 526 305 221 Chester 423 Digby 631 Erie 534 Ferris 400 404 364 408 320 534 0 0 59 80 223 0% 0% 0% 0% 0% 0% Number of Employees First Shift Second Shift Overtime % Turnover Rate New Employees Separated Employees Productivity Index 10.0% 10.0% 10.0% 10.0% 10.0% 10.0% 40 101 191 53 67 170 0 86 0 0 0 156 100.0% 100.0% 100.0% 100.0% 100.0% 100.0% Erie Ferris Sales Profit Contribution Margin Stock Price Emergency Loan Market Share Andrews $34,397 $3,947 41.50% $52.02 0.1 High Level Overview Baldwin Chester $126,889 $86,429 $19,761 $12,831 38.46% 36.59% $75.63 $59.05 $0 $0 23.8% 16.2% Digby $137,657 $27,438 42.94% $97.05 $0 25.9% $105,959 $5,962 29.22% $27.97 $17,106 19.9% $41,072 ($2,170) 25.05% $4.49 Average $88,734 $11,295 35.63% $52.70 $8,056 16.7% $0 $31,231 6.5% 7.7% Section 1 Research and Development 1.3 High Tech Expectations Performance 10.9 Size 9.1 Importance 33% Customer Buying Criteria Price Age Reliability Positioning 1.2 Low Tech Expectations $15.00 - $35.00 3 Years 14,000 - 20,000 Hours Performance 7.3 Size 12.7 Importance 41% 29% 21% 9% Customer Buying Criteria Positioning Age Price Reliability 0 Years 29% 25% $25.00 - $45.00 17,000 - 23,000 Hours 13% 1.4 Perceptual Map Name Performance Revision Date 20 18 6.0 7.1 10.8 16 14 D'EatFast Curr De Able Baker Bold Cake Cure Daze Dixie 8.4 12 cafuture Echo Bold 6.6 1.5 Product List Size Reliability Age 13.3 20,200 2.8 12.9 19,700 1.7 9.2 17,300 1.1 10.1 18,550 1.6 13.0 18,650 1.1 13.6 18,100 8.1 12.4 17,750 2.8 13.5 17,000 2.5 10.5 17,000 1.7 13.7 20,050 1.9 10.0 17,850 1.0 10 6.4 March 8, 2024 June 11, 2025 August 15, 2025 July 24, 2025 July 21, 2025 January 11, 2025 January 19, 2025 June 24, 2024 April 7, 2024 November 23, 2025 May 5, 2025 8 8.0 6 4 Eat 6.8 Echo 9.0 2 0 Fast 8.4 0 2 4 6 8 10 12 14 16 18 20 Performance Future 10.0 Section 2 | Marketing Low Tech 2.3 Market Share Importance Price 2.1 Customer Buying Criteria Expectations $15.00 - $35.00 3 Years 14,000 - 20,000 Hours Performance 7.3 Size 12.7 41% 29% Ferris 0.1% Andrews 9.5% Age Reliability Positioning 21% Erie 12.6% 9% 2.2 Demand Information 2025 Total Market Size Baldwin 29.1 % 2025 Total Units Sold 2026 Demand Growth Rate 8,117 8,117 10% Digby 39.0 % Chester 9.8 % Andrews Baldwin Chester Digby Erie Ferris Units Sold Name Price Stock Out V Customer Accessibility 63% Customer Satisfaction Potential Sold 4,230 1,205 373 Customer Awareness 100% Yes Baker $34.75 Daze $35.00 Promo Budget $1,900 $2,200 $2,200 2,361 2,225 25 Yes 72% 100% 6 943 Yes 3 Dixie $44.00 Able $44.00 2.4 Top Products Sales Age Performance Size Reliability Budget 1.7 7.1 12.9 19,700 $2,300 8.1 6.4 13.6 18,100 $2,200 2.8 8 12.4 17,750 $2,200 2.8 6 13.3 20,200 $550 1.1 6.6 13 18,650 $1,150 1.7 9 10.5 17,000 $2,200 2.5 6.8 13.5 17,000 $2,600 1.6 8.4 10.1 18,550 $1,300 1 10 10 17,850 $950 72% 15% 767 234 No $600 1 100% 58% 67% 92% 740 Yes 21% 9 Cure $34.50 Echo $40.25 Eat $44.50 651 1,612 317 112 Yes 3 14% 14% $1,350 $2,250 $2,450 $1,700 368 No 100% 1 Cake $44.50 56 28 Yes 21% 0 92% 50% Future $44.00 7 5 Yes 7% $950 0 High Tech 3.3 Market Share 3.1 Customer Buying Criteria Expectations Performance 10.9 Size 9.1 0 Years $25.00 - $45.00 17,000 -23,000 Hours Importance 33% 29% Andrews Positioning Age Price Reliability 0.3% Ferris 17.0% 25% Baldwin 20.5% 13% 3.2 Demand Information 2025 Total Market Size 2025 Total Units Sold 2026 Demand Growth Rate 5,375 5,375 20% Erie 29.0% Chester 25.3% Digby 7.9 % Andrews Baldwin Chester Digby Erie Ferris Units Sold Name Price Potential Sold Stock Out Customer Accessibility 86% Customer Awareness Customer Satisfaction V 1,428 1,137 Yes 15 Echo $40.25 Cake $44.50 Bold $42.00 92% 92% 753 Yes 56% 10 1,157 891 Yes 58% 25 1,280 959 61% 38% 711 Yes 50% 16 3.4 Top Products Sales Age Performance Size Reliability Budget 1.7 9 10.5 17,000 $2,200 1.6 8.4 10.1 18,550 $1,300 1.1 10.8 9.2 17,300 $1,500 1 10 10 17,850 $950 2.8 8 12.4 17,750 $2,200 1.7 7.1 12.9 19,700 $2,300 1.9 8.4 13.7 20,050 $1,200 1.1 6.6 13 18,650 $1,150 2.5 6.8 13.5 17,000 $2,600 8.1 6.4 13.6 18,100 $2,200 2.8 6 13.3 20,200 $550 394 246 Yes 81% Promo Budget $2,250 $1,700 $1,500 $950 $2,200 $1,900 $1,200 $1,350 $2,450 $2,200 $600 100% 3 213 380 Yes 61% 100% 6 205 39 No Future $44.00 Dixie $44.00 Baker $34.75 Fast $46.50 Cure $34.50 Eat $44.50 Daze $35.00 Able $44.00 79% 2 478 Yes 38% 56% 86% 201 133 2 67% 100% 68 No 0 28 24 Yes 81% 0 100% 58% 14 11 No 18% 0 Section 4 Production Production vs Capacity Andrews 2,376 2,500 3,466 Baldwin 2,000 2,154 Chester | 1,850 3,589 Digby 2,350 Erie 2,970 3,000 2,253 Ferris 1,900 0 250 500 750 1000 1250 1500 1750 2000 2250 2500 2750 3000 3250 3500 3750 4000 Production Capacity 4.1 Plant Information Name Units Sold Inventory Price Material Cost Labor Cost Auto. Next Round Plant Utilization Units Produced 2,376 2,574 Able 4 96% 782 2,574 Baker $9.60 $10.80 $17.04 $9.45 $10.03 $10.45 1,907 $44.00 0 $34.75 0 $42.00 0 $44.50 5.5 200% Bold 891 891 Contribution Margin 41.5% 39.8% 35.3% 40% 30.9% 43.7% 41.9% 5 129% Cake 1,213 1,213 $11.06 3.6 129% Primary Segment Low Tech Low Tech High Tech High Tech Low Tech Low Tech High Tech Low Tech High Tech High Tech High Tech Cure Capacity Next Round 2,500 1,900 1,200 1,250 900 2,000 1,150 1,800 1,200 1,200 941 941 0 2 106% $14.43 $9.94 $9.00 $11.55 0 Daze Dixie $34.50 $35.00 $44.00 2,253 1,337 5 2,253 1,337 $12.45 $10.20 $13.50 152% 159% 0 3 Eat 501 2,564 $44.50 $9.16 $8.10 32.1% 5 100% 1,782 1,188 1,560 0 $14.05 1.5 Echo Fast Future 100% 2,079 205 717 $40.25 $46.50 $44.00 $12.83 $10.82 28.4% -21.1% 2,648 $11.73 4 143% 693 0 $15.70 $10.81 39% 3 800 88% Section 5 | Finance 5.1 Income Statement Andrews Baldwin Chester Erie Ferris Digby $137,657 Sales $34,397 $126,889 $86,429 $105,959 $41,072 Variable Costs Direct Material Direct Labor $37,518 $42,944 $35,142 $29,673 $25,129 $7,990 $7,575 $4,556 $20,121 $14,277 $41,029 $0 $0 $36,577 $32,668 $5,756 $75,001 $30,958 $0 $54,802 $31,626 $13,720 $10,057 $7,008 $30,784 $10,288 $78,086 $48,803 $78,548 $59,109 Inventory Carry Total Variable Costs (Labor, Material, Carry) Contribution Margin Period Costs Depreciation SG&A $4,200 $5,627 $2,540 $4,847 $4,080 $2,720 R&D $0 $0 $1,234 $600 $4,700 $2,150 Promotions Sales $550 $1,062 $3,400 $3,800 $2,004 $15,892 $32,910 $986 Administration Total Period Costs Net Margin Other (Fees/Write-offs/Bonuses/Relocation Fee) EBIT Interest (Short term/Long Term) Taxes Profit Sharing Net Profit $1,113 $3,050 $2,450 $1,488 $10,641 $20,986 $23 $20,963 $819 $7,050 $262 $12,831 $82 $4,400 $4,400 $2,235 $15,964 $43,146 $0 $43,146 $814 $6,336 $7,940 $0 $7,940 $1,745 $2,168 $81 $3,947 $4,800 $2,423 $16,003 $14,955 $725 $14,230 $4,870 $3,276 $122 $5,962 $2,150 $683 $8,937 $1,351 $428 $923 $4,262 ($1,168) $0 ($2,170) $32,096 $1,075 $10,858 $72 $15,076 $560 $403 $19,761 $27,438 5.2 Cash Flow Statement Andrews Baldwin Chester Erie Ferris Digby $12,037 $41,435 $11,565 $27,874 $0 $0 $3,947 $19,761 $12,831 $27,438 $5,962 ($2,170) $4,200 $2,540 $4,847 $5,627 $7 $4,080 $0 $2,720 $148 $0 $0 $0 ($627) $1,117 $1,048 $0 ($30,862) $4,467 ($18,875) $1,576 $0 ($858) $16,090 ($2,374) $4,995 ($2,501) $10,163 $0 ($2,672) $30,660 $316 ($28,311) ($1,036) ($28,334) ($2,323) $24,188 $0 ($35,200) ($6,120) ($23,100) $0 ($2,200) Starting Cash Position Cash From Operations Net Income(Loss) Adjustment For Non-Cash Items Depreciation Extraordinary Gains/Losses/Write-offs Changes in Current Assets And Liabilities Accounts Payable Inventory Accounts Receivable Net Cash From Operations Cash From Investing Net Plant Improvements Cash From Financing Dividends Paid Sales Of Common Stock Purchase Of Common Stock Cash From Long-Term Debt Issued Early Retirement of Long-Term Debt Retirement of Current Debt Cash From Current Debt Borrowing Cash From Emergency Loan Net Cash From Financing Effect Of Exchange Rates Net Change In Cash Ending Cash Position $0 $0 $0 $0 $0 $2,900 $0 $0 $5,000 $0 $0 $0 $0 ($1,586) $8,000 $0 $8,100 ($100) ($2,144) $0 $0 ($1,500) $0 $0 $0 $0 $0 $11,600 $0 $0 ($8,333) $0 $0 $0 ($2,000) ($3,687) $0 ($41,768) $0 $0 $0 $0 $0 $0 $0 $0 $31,231 $30,544 $12,270 $0 $17,106 ($10,163) $0 ($8,333) $0 $0 $0 $0 ($1,500) $0 $8,470 $36,344 $1,258 $7,560 $0 $11 ($27,209) $14,227 $12,823 $19,596 $0 $0 5.3 Balance Sheet Andrews Baldwin Chester Erie Ferris Cash $12,823 $10,429 $0 $0 Digby $19,596 $11,314 $36,344 $7,104 $0 $0 $43,448 Accounts Receivable Inventory Current Assets Plant and Equipment Accumulated Depreciation Fixed Assets Total Assets Accounts Payable Current Debt Current Liabilities Long-Term Liabilities Total Liabilities Common Stock Retained Earnings Total Equity Total Liabilities & Equity $14,227 $2,827 $37,968 $55,022 $63,000 ($18,587) $44,413 $99,436 $3,816 $0 $3,816 $18,200 $22,016 $18,823 $58,597 $77,420 $99,436 $23,252 $84,400 ($18,613) $65,787 $89,039 $6,418 $0 $30,911 $72,700 ($18,021) $54,679 $85,589 $6,456 $0 $6,456 $556 $7,012 $2,323 $76,254 $78,577 $85,589 $38,100 ($11,997) $26,104 $69,551 $4,504 $0 $4,504 $7,383 $11,887 $2,248 $55,416 $57,664 $69,551 $0 $8,709 $47,964 $56,673 $61,200 ($19,457) $41,743 $98,416 $5,281 $17,106 $22,386 $18,800 $41,186 $10,523 $46,706 $57,229 $98,416 $3,376 $58,398 $61,774 $40,800 ($13,720) $27,080 $88,854 $4,281 $31,231 $35,512 $748 $6,418 $11,207 $17,625 $11,023 $60,390 $71,413 $89,039 $36,260 $19,723 $32,871 $52,594 $88,854 Company Book Value EPS Dividend Yield P/E $0.00 32.46 Andrews Baldwin Closing Price $52.02 $75.63 $59.05 $97.05 $27.97 $4.49 Change ($12.00) $22.85 $13.40 5.4 Stock Market Summary Shares Outstanding Market Cap 2,462,486 $128m 2,172,119 $164m 1,967,138 $116m 2,000,000 $194m 2,449,626 $69m 2,546,614 $11m $0.73 $0.00 8.31 9.05 Chester $31.44 $32.88 $29.31 $39.29 $23.36 $20.65 $1.60 $9.10 $6.52 $13.72 $2.43 ($0.85) 0% 1% 0% 0% 0% 0% $36.07 Digby Erie Ferris $0.00 $0.00 7.07 11.49 $6.91 ($22.91) $0.00 -5.27 Company Series S&P Rating Andrews 13.0S2026 8.8S2033 9.1S2034 AAA AAA Baldwin AAA AAA AAA 13.0S2026 8.7S2034 8.6S2035 13.0S2026 10.082031 10.1 S2032 5.6 Bond Market Summary Face Value Yield $2,600,000 12.51% $4,300,000 8.75% $11,300,000 8.88% $2,507,220 12.49% $600,000 8.65% $8,100,000 8.6% $2,582,783 12.48% $1,100,000 9.36% $3,700,000 9.34% $556,049 12.47% $2,600,000 12.7% $1,800,000 10.18% $2,800,000 9.82% $11,600,000 10.85% $747,634 12.68% Next Year's Prime Rate: 7% Closing Price $103.96 $100.56 $102.43 $104.05 $100.61 $100.00 $104.15 $106.83 $108.19 $104.24 $102.36 $98.28 $94.71 $107.85 $102.54 Chester AAA AAA AAA Digby 13.0S2026 13.0S2026 10.082031 9.352032 11.752035 13.0S2026 AAA BBB BBB BBB BBB Erie Ferris BBB 5.7 Net Profit $30000 $25000 $20000 $15000 $10000 $5000 $0 $-5000 Andrews Baldwin Chester Digby Erie Ferris Section 6 Product Financials Sales Variable Con Fixed Cost Net Margin 6.1 Andrews Income Statement A, $34,397 $20,121 $6,336 $7,940 Total $34,397 $20,121 $6,336 $7.940 $0 $1,745 $2,168 $81 $3,947 Other (Fees, Writeoffs) Long Term Interest Profit Sharing Net Profit Sales Variable Con Fixed Cost Nel Margin 6.2 Baldwin Income Statement Baker Bold $89,461 $37,428 $53,877 $2,209 $9,601 $8,291 $25,983 $6,928 Total $128 80 $78,086 $15,892 $32,910 $814 $1,075 $10,858 $403 $19,761 Other (Fees, Writeoffs) Long Term interest Taxes & Tariffs Profit Sharing Net Profit Cure Sales Variable Cost Fixed Cost Net Margin 6.3 Chester Income Statement Cake $53,978 $32,453 $32,378 $22,424 56,191 $4,450 $15407 $5,578 Total $86.429 $54802 $10.641 $20.986 $23 $819 57,050 $282 $12831 Other (Fees, Writeollis) Long Term rest Taxes & Tariffs Profit Sharing Net Profit DO Sales Variable Cou Fixed Cost Net Margin 6.4 Digby Income Statement Dixie $78,842 $58,816 $14,365 $34,183 $9,177 $6,787 $25,300 $17,846 Total $137.657 $78,548 $15,964 $43,146 $0 $72 $15,076 $580 $27,438 Other (Fees, Writeoffs) Long Term Interest Taxes & Tarifs Profit Sharing Net Profil Total Sales Variable Cost Fkred Cost Net Margin 6.5 Erie Income Statement Eat Echo $22,282 $83,677 $15,123 $59,878 $8,679 $7,323 ($1,520) $16,475 $106,959 $75,001 $16,003 $14,955 $725 Other (Fees, Writeos) Long Term Interest Taxes & Tariffs Profit Sharing Net Profi $2,136 $3,276 $122 $5,962 Section 7 Custom Modules Andrews 404 7.1 Workforce Summary Baldwin 526 305 221 Chester 423 Digby 631 Erie 534 Ferris 400 404 364 408 320 534 0 0 59 80 223 0% 0% 0% 0% 0% 0% Number of Employees First Shift Second Shift Overtime % Turnover Rate New Employees Separated Employees Productivity Index 10.0% 10.0% 10.0% 10.0% 10.0% 10.0% 40 101 191 53 67 170 0 86 0 0 0 156 100.0% 100.0% 100.0% 100.0% 100.0% 100.0%


