

Question: Need help with computers and Peripheral The following table shows income statement and balance sheet data for five U.S.industries in 2017. INCOME STATEMENT AND BALANCE
Need help with computers and Peripheral
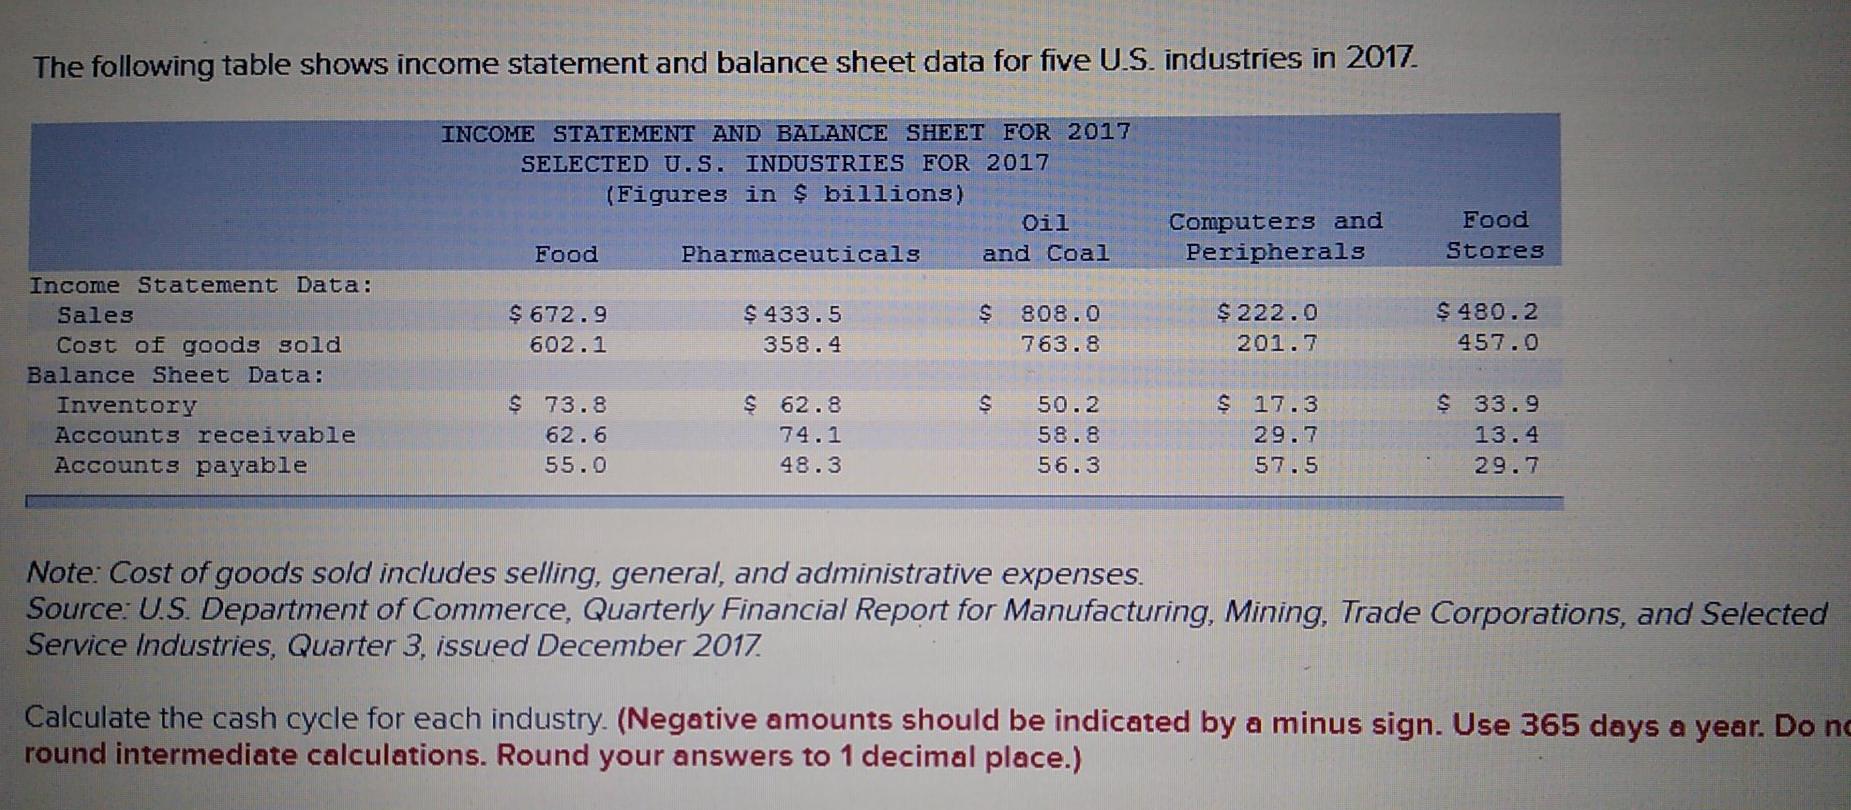
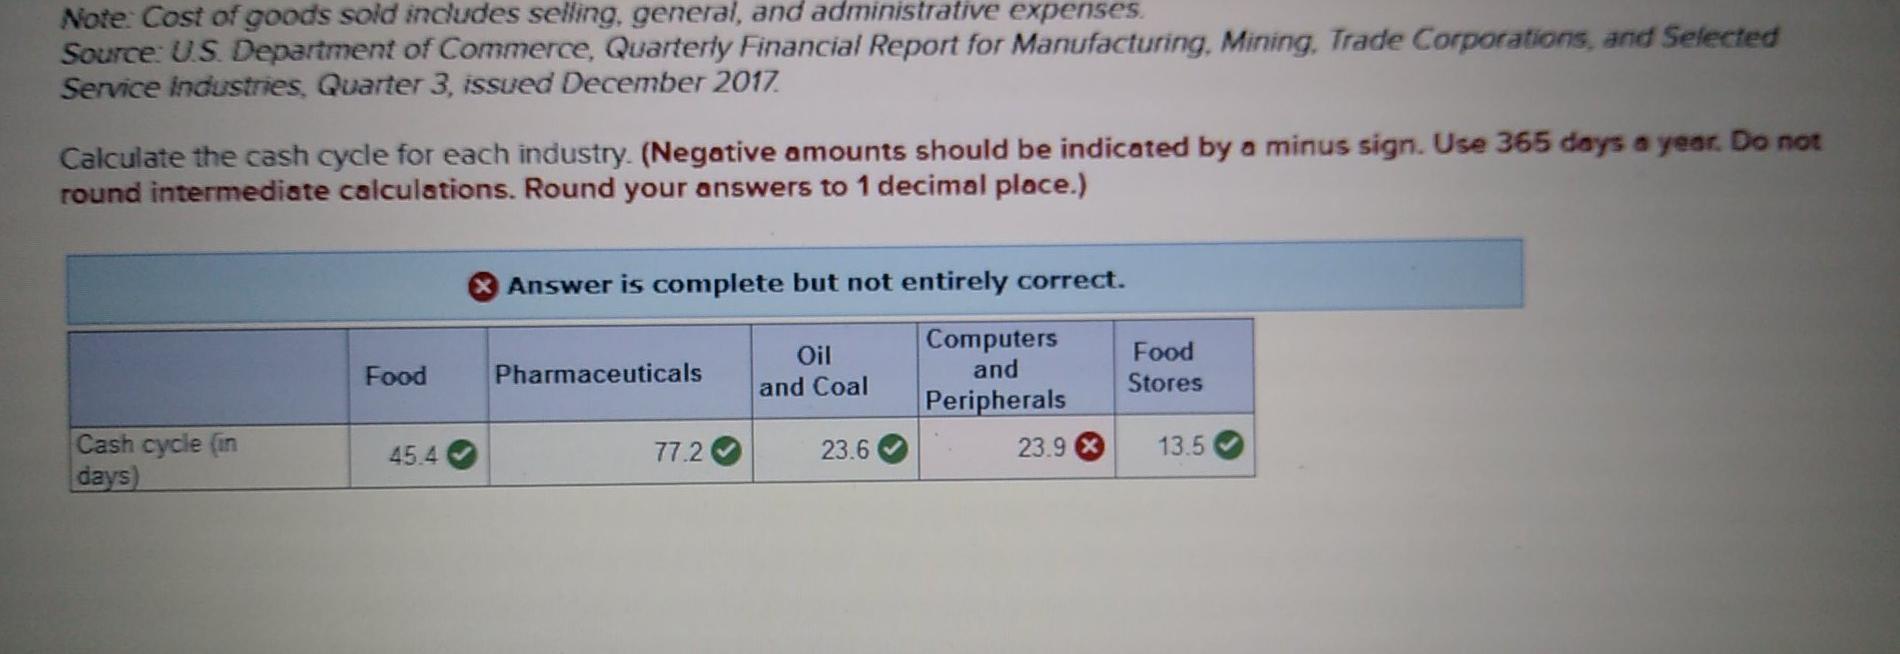
The following table shows income statement and balance sheet data for five U.S.industries in 2017. INCOME STATEMENT AND BALANCE SHEET FOR 2017 SELECTED U.S. INDUSTRIES FOR 2017 (Figures in $ billions) Oil Food Pharmaceuticals and Coal Computers and Peripherals Food Stores S $ 672.9 602.1 $ 433.5 358.4 808.0 763.8 $ 222.0 201.7 $ 480.2 457.0 Income Statement Data: Sales Cost of goods sold Balance Sheet Data: Inventory Accounts receivable Accounts payable S $ 73.8 62.6 55.0 S 62.8 74.1 48.3 50.2 58.8 56.3 $ 17.3 29.7 57.5 $ 33.9 13.4 29.7 Note: Cost of goods sold includes selling, general, and administrative expenses. Source: U.S. Department of Commerce, Quarterly Financial Report for Manufacturing, Mining, Trade Corporations, and Selected Service Industries, Quarter 3, issued December 2017. Calculate the cash cycle for each industry. (Negative amounts should be indicated by a minus sign. Use 365 days a year. Do no round intermediate calculations. Round your answers to 1 decimal place.) Note Cost of goods sold includes selling, general, and administrative expenses. Source: US Department of Commerce, Quarterly Financial Report for Manufacturing, Mining, Trade Corporations, and Selected Service industries, Quarter 3, issued December 2017 Calculate the cash cycle for each industry. (Negative amounts should be indicated by a minus sign. Use 365 days a year. Do not round intermediate calculations. Round your answers to 1 decimal place.) Answer is complete but not entirely correct. Food Pharmaceuticals Oil and Coal Computers and Peripherals 23.9 X Food Stores Cash cycle in days) 45.4 77.2 23.6 13.5
Step by Step Solution
There are 3 Steps involved in it

Get step-by-step solutions from verified subject matter experts