

Question: Need help with creating a simple frequency table asap for statistics!! Construct the frequency distribution for drive-through service times for Burger King lunches using the
Need help with creating a simple frequency table asap for statistics!!
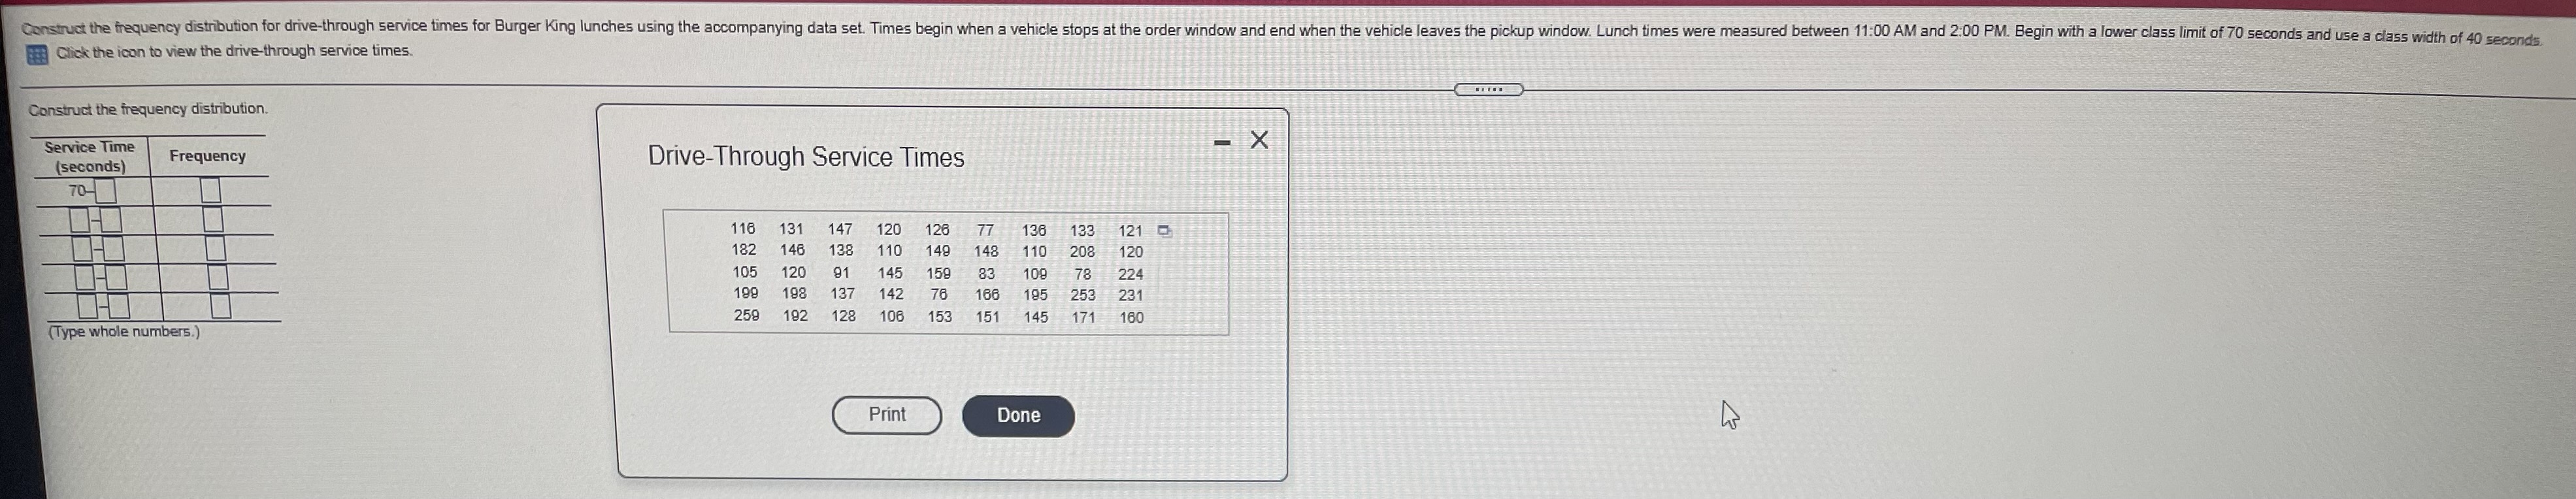
Construct the frequency distribution for drive-through service times for Burger King lunches using the accompanying data set. Times begin when a vehicle stops at the order window and end when the vehicle leaves the pickup window. Lunch times were measured between 11:00 AM and 2:00 PM. Begin with a lower class limit of 70 seconds and use a class width of 40 seconds. Click the icon to view the drive-through service times. Construct the frequency distribution. - X Service Time Frequency Drive-Through Service Times (seconds) 70- 116 131 147 120 126 77 136 133 121 182 146 138 110 149 148 110 208 120 105 120 91 145 159 83 109 78 224 681 198 137 142 76 166 195 253 231 258 192 128 106 153 151 145 171 160 (Type whole numbers.) Print Done
Step by Step Solution
There are 3 Steps involved in it

Get step-by-step solutions from verified subject matter experts