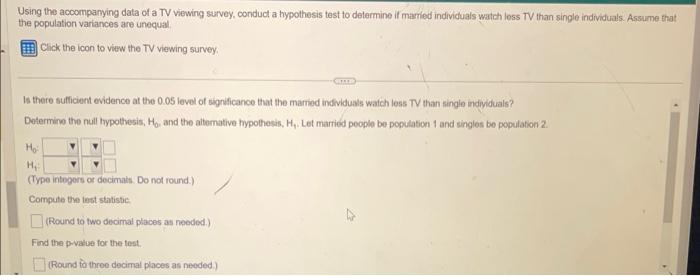
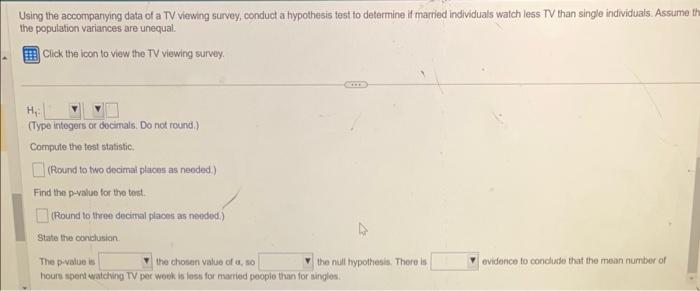
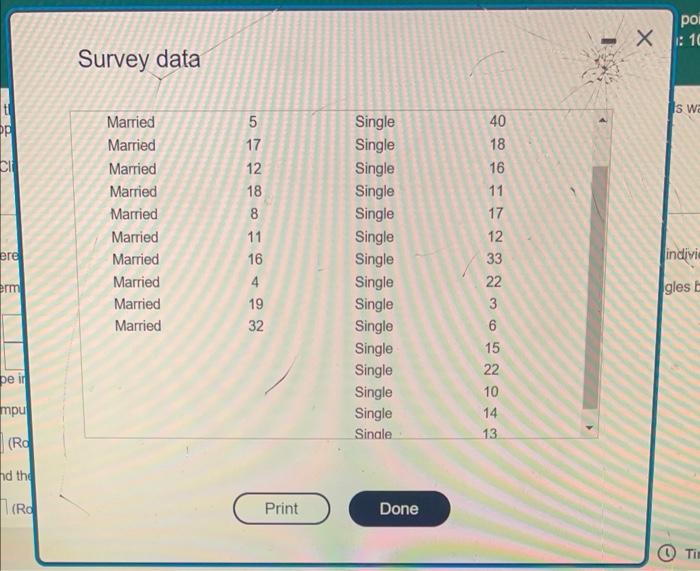
Question: Need help with excel work Using the accompanying data of a TV viewing survey, conduct a hypothesis test to determine if married individuals watch loss

Need help with excel work
Need help with excel work Using the accompanying
Using the accompanying data of a TV viewing survey, conduct a hypothesis test to determine if married individuals watch loss TV than single individuals. Assume that the population variances are unequal. Click the icon to view the TV viewing survey. Is there sufficient evidence at the 0.05 level of dignificance that the marred individuals watch less TV than single individuals? Dotermine the null typothesis, H0, and the altemative hypothesib, H1. Let married people be population 1 and singles be population 2 . (Type integers or decimats. Do not round.) Compute the lest statistic: (Round to two decimal places as needed.) Find the p-value for the test. (Round to three decirral places as needed) Using the accomparying data of a TV viewng survey, conduct a hypothesis test to determine if married individuals watch less TV than single individuals. Assume the population variances are unequal. Click the icon to view the TV viewing survey. (Type integers or decinals. Do not round.) Compute the test statistic. (Round to two decimal places as neoded) Find the p-value for the tost. (Round to throe decimal placos as needid.) State the condusion. The p-value is the chosen value of a, so the nuil hypothesis. There is evidence to concluste that the mean number of hours spent watching TV per woek is loss for married people tran for singlos. Survey data

Step by Step Solution

There are 3 Steps involved in it

1 Expert Approved Answer
Step: 1 Unlock blur-text-image
Question Has Been Solved by an Expert!

Get step-by-step solutions from verified subject matter experts

Step: 2 Unlock
Step: 3 Unlock

Students Have Also Explored These Related General Management Questions!