

Question: Need help with finance calculations formulars / results using the attached case study for the following please : 1 - Cost of Debt 2 -
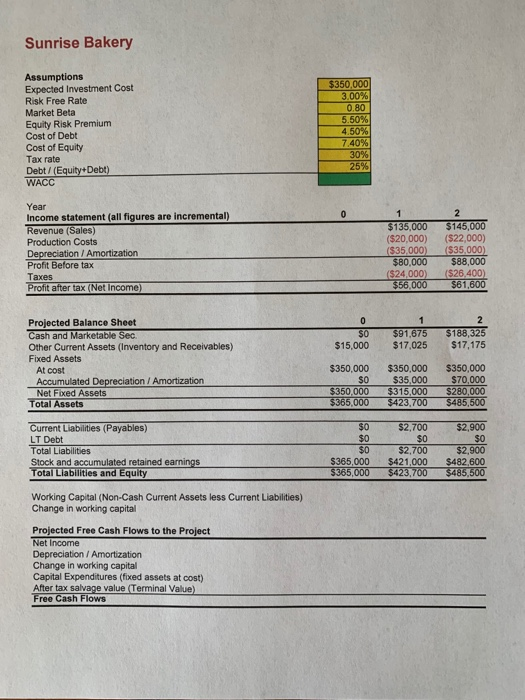
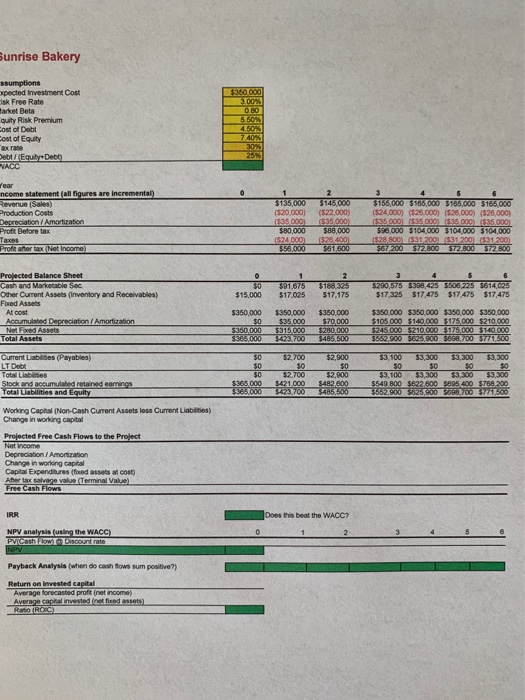
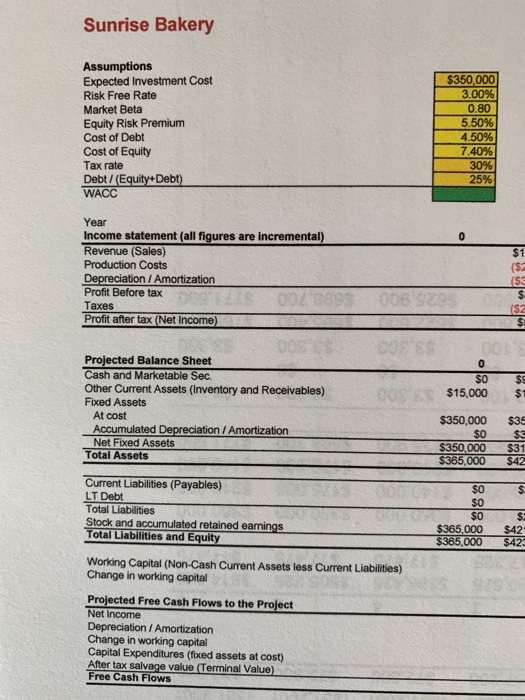
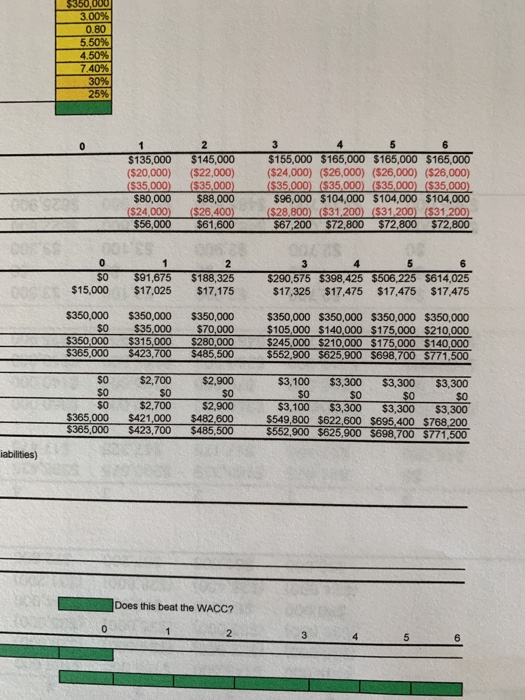
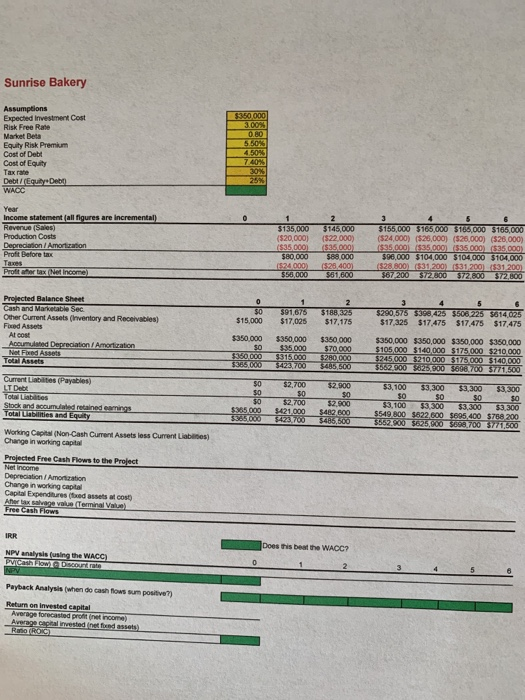
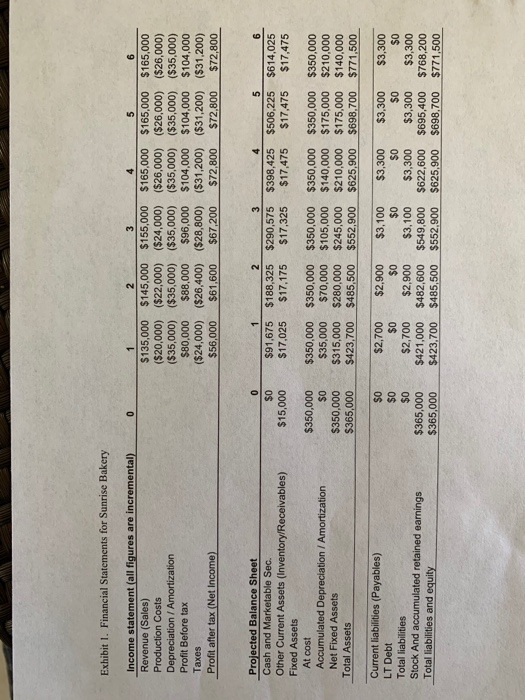
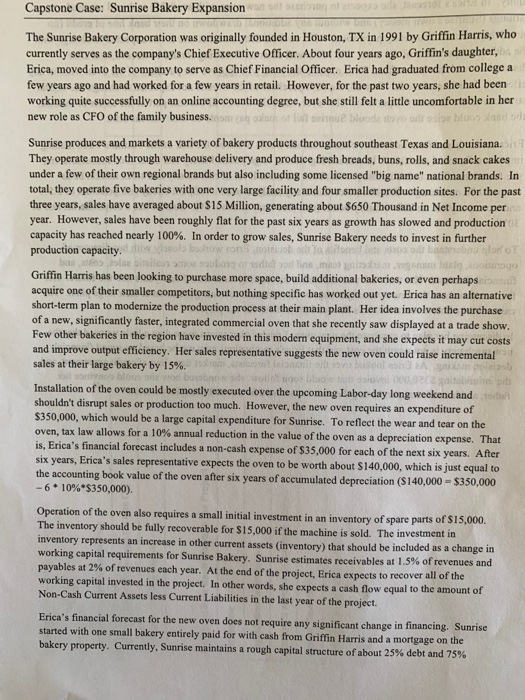
Sunrise Bakery Assumptions Expected Investment Cost Risk Free Rate Market Beta Equity Risk Premium Cost of Debt Cost of Equity Tax rate Debt / (Equity+Debt) WACC $350,000 3.00% 0.80 5.50% 4.50% 7.40% 30% 25% 0 Year Income statement (all figures are incremental) Revenue (Sales) Production Costs Depreciation / Amortization Profit Before tax Taxes Profit after tax (Net Income) 1 $135,000 ($20,000) ($35,000 $80,000 ($24,000) $56,000 2 $145,000 ($22,000) ($35,000) $88,000 ($26.400) $61,600 1 0 SO $15,000 $91,675 $17,025 2 $ 188,325 $17,175 Projected Balance Sheet Cash and Marketable Sec Other Current Assets (Inventory and Receivables) Fixed Assets At cost Accumulated Depreciation / Amortization Net Fixed Assets Total Assets $350,000 $0 $350,000 $365,000 $350,000 $35,000 $315,000 $423.700 $350,000 $70,000 $280,000 $485,500 Current Liabilities (Payables) LT Debt Total Liabilities Stock and accumulated retained earnings Total Liabilities and Equity $0 $0 $0 $365,000 $365,000 $2,700 $0 $2,700 $421,000 $423,700 $2,900 $0 $2,900 $482,600 $485,500 Working Capital (Non-Cash Current Assets less Current Liabilities) Change in working capital Projected Free Cash Flows to the Project Net Income Depreciation / Amortization Change in working capital Capital Expenditures (fixed assets at cost) After tax salvage value Terminal Value) Free Cash Flows Sunrise Bakery sumptions xpected Investment Cost isk Free Rate Tarket Beta quity Risk Premium cost of Debt Cost of Equity ex rate Debt/Equity Debo VACC SLOOOO 3.00% 5.50% 250% 7.40 30% Year income statement (all figures are incremental) Revenue (Sales) Production Costs Depreciation / Amortization Profit Before tax Taxes Profit arter tax (Net Income) 1 $135,000 (520,000) $35 000 $80,000 $24.000 $56,000 2 3145.000 (522,000) (535.000 $88,000 (548.400 $61,600 3 6 $156,000 $100,000 $765,000 $165.000 (524,000) (525.000) (525.000) (526,000) $35.000 (335.000.000 $35.000) 596,000 $104.000 5104.000 $104,000 5:28.800531200831200831200 567/200 $12.800 $72.800 5727800 30 $15,000 1 $91.675 $17.025 2 $168325 $17,175 3 5 6 $290,575 $398,425 $506 225 5614,025 $17,325 $17.475 $17.475 $17,475 Projected Balance Sheet Cash and Marketable Sec Other Current Assets (Inventory and Receivable) Fixed Assets Al cost Accumulated Depreciation / Amortization Net Foxed Assets Total Assets $350,000 $0 5360 DOO $385.000 $350,000 $35.000 3315.000 3423.700 $350.000 $70,000 5280,000 $485 500 $350,000 $350,000 $350,000 $350,000 $105 000 $140,000 $175,000 $210,000 5245.000 $210.000 $175,000 $140.000 $562.500 5625.000 3868,700 5771.500 Current Liabilities (Payables) LT Debt Total Liabities Stock and could retained earings Total Unities and Equity 50 $0 $0 $365.000 5966000 52.700 $0 $2,700 $421 000 $423700 $2,900 50 $2,900 S4A2,500 5485,500 53.100 $3,300 $3,300 $3,300 SO SO 50 $3,100 $3,300 $3,300 $3,300 $549 800 $822 600 5895 400 5768 200 5562,500 $825,900 5690 700 771.500 Working Capital (Non-Cash Current Assets loss Current Liabilities) Change in working capital Projected Free Cash Flows to the Project Net Income Depreciation / Amortization Change in working capital Capital Expenditures (foued assets Cost) Afer tax salvege value Terminal Value) Free Cash Flows IRR Does this beat the WACC? NPV analysis using the WACC) PViCash How Discount rate Payback Analysis (when do cash flows sum positive) Return on invested capital Average forecasted profit net income) Average capital invested and assets) ROTROS Sunrise Bakery Assumptions Expected Investment Cost Risk Free Rate Market Beta Equity Risk Premium Cost of Debt Cost of Equity Tax rate Debt / (Equity+Debt) WACC $350,000 3.00% 0.80 5.50% 4.50% 7.40% 30% 25% Year Income statement (all figures are incremental) Revenue (Sales) Production Costs Depreciation / Amortization Profit Before tax DO2389 Taxes Profit after tax (Net Income $1 ($ ($3 006 90 ($2 O $0 $15,000 $ $1 Projected Balance Sheet Cash and Marketable Sec. Other Current Assets (Inventory and Receivables) Fixed Assets At cost Accumulated Depreciation / Amortization Net Fixed Assets Total Assets $350,000 $0 $350,000 $365,000 $35 $3 $31 $42 $ $o $0 $0 $365,000 $365,000 $ $42 $423 Current Liabilities (Payables) LT Debt Total Liabilities Stock and accumulated retained earnings Total Liabilities and Equity Working Capital (Non-Cash Current Assets less Current Liabilities) Change in working capital Projected Free Cash Flows to the Project Net Income Depreciation / Amortization Change in working capital Capital Expenditures (fixed assets at cost) After tax salvage value Terminal Value) Free Cash Flows $350,000 3.00% 0.80 5.50% 4.50% 7.40% 30% 25% 0 1 $135,000 ($20,000) ($35,000) $80,000 ($24,000) $56,000 2 $145,000 ($22,000) ($35,000) $88,000 ($26,400) $61,600 3 5 $155,000 $165,000 $165,000 $165,000 ($24,000) ($26,000) ($26,000) ($26,000) ($35,000) ($35.000 ($35,000) ($35,000) $96,000 $104,000 $104,000 $104,000 ($28,800) ($31,200) ($31,200) ($31, 200) $67,200 $72,800 $72,800 $72,800 0 $0 $15,000 1 $91,675 $17,025 2 $188,325 $17,175 3 4 5 6 $290,575 $398,425 $506,225 $614,025 $17,325 $17,475 $17,475 $17,475 $350,000 $0 $350,000 $365,000 $350,000 $35,000 $315,000 $423,700 $350,000 $70,000 $280,000 $485,500 $350,000 $350,000 $350,000 $350,000 $105,000 $140.000 $175,000 $210,000 $245,000 $210,000 $175,000 $140,000 $552,900 $625,900 $698,700 $771.500 $0 $0 $0 $365,000 $365,000 $2,700 $O $2,700 $421,000 $423,700 $2,900 $0 $2,900 $482 600 $485,500 $3,100 $3,300 $3,300 $3,300 $0 $0 $0 $0 $3,100 $3,300 $3,300 $3,300 $549,800 $622,600 $695,400 $768,200 $552,900 $625,900 $698,700 $771,500 iabilities) Does this beat the WACC? 2 5 Sunrise Bakery Assumptions Expected investment Cost Risk Free Rate Market Beta Equity Risk Premium Cost of Debt Cost of Equity Tax rate Debt / (Equity Den WACO $350,000 3.00 0.80 5.60% 4.50% 7.40% 30% Year Income statement all figures are incremental) Revenue (Sales) Production Costs Depreciation / Amortization Profit Before tax Taxes Profiter (Net income $135,000 (520,000) 1$35,000 $80,000 1524.000) 550.000 2 $145,000 (522,000) $35.000 $88.000 525.400 $61,600 3 $155,000 3165,000 $165.000 $165,000 (524,000) ($20,000) (526,000) (526,000) $35.000 $35.000 (535.000) (535 000) 596.000 $104,000 $104,000 $104.000 ($28.800531,200 $31200831 200 $67200 S72300 $72.800 $72,800 $0 $15,000 $91,675 $17,025 2 $188,325 $17,175 Projected Balance Sheet Cash and Marketable Sec Other Current Assets (Inventory and Receivables) Fixed Assets Al cost Acumulated Depreciation Amortization Not Fixed Assets Total Assets 3 4 5 6 $290,575 333,425 $506 225 5614,025 $17,325 $17.475 $17.475 $17,475 $350,000 30 $350.000 $35.000 $350,000 $35.000 $315.000 3423,700 $350.000 $70,000 $280.000 5485,500 $350,000 $350,000 $350,000 $350,000 5105000 5140 000 $175,000 $210 000 $245 000 $210 000 $175,000 $140,000 3562300 $825.9003698.700 577/1,500 $0 50 $0 $365.000 $365.000 52,700 50 $2.700 $421.000 $423 700 $2.000 30 52.900 $482.600 3486,500 $3,100 $3,300 $3,300 $3,300 SO SO $0 $0 $3,100 $3,300 $3,300 $3,300 $549,800 $622,600 $695,400 $788200 36627.00 $625000 $398 700 5771,800 Current Liabilities ( Payables) LT Debt Totabilities Stock and accumulated retained earnings Total abilities and Equity Working Capital (Non-Cash Current Assets loss Current Liabies) Change in working capital Projected Free Cash Flows to the Project The income Depreciation / Amortization Change in working capital Capital Expenditures freed assets atos Ahor tax salvage valus Terminal Value Free Cash Flows Does this beat the WACC? IRR NPV analysis using the WACC) Prvi Cashow Discount rate INPV Payback Analysis (when do cash flows sum positive) Return on invested capital Average forecasted profit net income Average capital invested netfand assets) ROROC Exhibit 1. Financial Statements for Sunrise Bakery 0 Income statement (all figures are incremental) Revenue (Sales) Production Costs Depreciation / Amortization Profit Before tax Taxes Profit after tax (Net Income 1 2 3 $135,000 $145,000 $155,000 $165,000 $165,000 $165,000 ($20,000) ($22,000) ($24,000) ($26,000) ($26,000) ($26,000) ($35,000) ($35,000) ($35,000) ($35,000) ($35,000) ($35,000) $80,000 $88,000 $96,000 $104,000 $104,000 $104,000 ($24,000) ($26,400) ($28,800) ($31,200) ($31,200) ($31,200) $56,000 $61,600 $67,200 $72,800 $72,800 $72,800 0 $0 $15,000 $91,675 $17,025 2 $188,325 $17,175 3 $290,575 $17,325 4 5 $398,425 $506,225 $17,475 $17,475 6 $614,025 $17,475 Projected Balance Sheet Cash and Marketable Sec. Other Current Assets (Inventory/Receivables) Fixed Assets At cost Accumulated Depreciation / Amortization Net Fixed Assets Total Assets $350,000 $0 $350,000 $365,000 $350,000 $350,000 $350,000 $350,000 $350,000 $350,000 $35,000 $70,000 $105,000 $140,000 $175,000 $210,000 $315,000 $280,000 $245,000 $210,000 $175,000 $140,000 $423,700 $485,500 $552,900 $625,900 $698,700 $771,500 Current liabilities (Payables) LT Debt Total liabilities Stock And accumulated retained earnings Total liabilities and equity $0 $0 $0 $365,000 $365.000 $2,700 $2,900 $0 $0 $2,700 $2,900 $421,000 $482,600 $423,700 $485,500 $3,100 $0 $3,100 $549,800 $552.900 $3,300 $0 $3,300 $622,600 $625,900 $3,300 $0 $3,300 $695,400 $698,700 $3,300 $0 $3,300 $768,200 $771,500 Capstone Case: Sunrise Bakery Expansion and TO SVOM The Sunrise Bakery Corporation was originally founded in Houston, TX in 1991 by Griffin Harris, who currently serves as the company's Chief Executive Officer. About four years ago, Griffin's daughter, Erica, moved into the company to serve as Chief Financial Officer. Erica had graduated from college a few years ago and had worked for a few years in retail. However, for the past two years, she had been working quite successfully on an online accounting degree, but she still felt a little uncomfortable in her new role as CFO of the family business. bor Sunrise produces and markets a variety of bakery products throughout southeast Texas and Louisiana. They operate mostly through warehouse delivery and produce fresh breads, buns, rolls, and snack cakes under a few of their own regional brands but also including some licensed "big name" national brands. In total, they operate five bakeries with one very large facility and four smaller production sites. For the past three years, sales have averaged about $15 Million, generating about $650 Thousand in Net Income per year. However, sales have been roughly flat for the past six years as growth has slowed and production capacity has reached nearly 100%. In order to grow sales, Sunrise Bakery needs to invest in further production capacity. 01 od is Griffin Harris has been looking to purchase more space, build additional bakeries, or even perhaps acquire one of their smaller competitors, but nothing specific has worked out yet. Erica has an alternative short-term plan to modernize the production process at their main plant. Her idea involves the purchase of a new, significantly faster, integrated commercial oven that she recently saw displayed at a trade show. Few other bakeries in the region have invested in this modern equipment, and she expects it may cut costs and improve output efficiency. Her sales representative suggests the new oven could raise incremental sales at their large bakery by 15%. bodo Installation of the oven could be mostly executed over the upcoming Labor-day long weekend and shouldn't disrupt sales or production too much. However, the new oven requires an expenditure of $350,000, which would be a large capital expenditure for Sunrise. To reflect the wear and tear on the oven, tax law allows for a 10% annual reduction in the value of the oven as a depreciation expense. That is, Erica's financial forecast includes a non-cash expense of $35,000 for each of the next six years. After six years, Erica's sales representative expects the oven to be worth about $140,000, which is just equal to the accounting book value of the oven after six years of accumulated depreciation (S140,000 = $350,000 -6. 10%*$350,000). Operation of the oven also requires a small initial investment in an inventory of spare parts of $15,000. The inventory should be fully recoverable for $15,000 if the machine is sold. The investment in inventory represents an increase in other current assets (inventory) that should be included as a change in working capital requirements for Sunrise Bakery. Sunrise estimates receivables at 1.5% of revenues and payables at 2% of revenues each year. At the end of the project, Erica expects to recover all of the working capital invested in the project. In other words, she expects a cash flow equal to the amount of Non-Cash Current Assets less Current Liabilities in the last year of the project. Erica's financial forecast for the new oven does not require any significant change in financing. Sunrise started with one small bakery entirely paid for with cash from Griffin Harris and a mortgage on the bakery property. Currently, Sunrise maintains a rough capital structure of about 25% debt and 75% equity. In Erica's forecast, she expects to purchase the new oven with available cash and retained earnings (Sunrise's own money) and without any additional drawdown on their bank line of credit (no new debt). Sunrise currently pays about 4.5% on their debt, and that rate is not expected to change with the additional purchase of the oven. No additional external financing should be needed, and after discussions with her loan office, Erica expects the bank will approve the purchase of the oven without any effect on their line of credit. Overall, the cash purchase of the oven is not expected to change the capital structure of the Sunrise Corporation. However, since the oven will become part of the assets of Sunrise, the bank could seize the oven should Sunrise fail to make payments on their current debt. Erica remembered from her online classes that she needs to assess the risk of her business when making important financial decisions. In rescarching similar large public bakery and other food manufacturers, she found that firms in her industry with about the same level of risk mostly had stock market betas around 0.80 on average. She also noted that many analysts used a ballpark equity risk premium of 5.5% and a current yield on U.S. treasury bonds (risk-free rate) of about 3%. Sunrise has a corporate tax rate of 30% To help understand the costs and benefits of the decision, Erica worked closely with her director of operations, plant manager, marketing team, and her father to produce some realistic sales, costs, and financial forecasts. Her team felt uncomfortable forecasting more than 5 or 6 years into the future. Her focus was on how the new oven might improve incremental revenue generation at their large plant. The case exhibits below contain Erica's financial projections for the project. In discussing her plan to purchase the new oven, Erica's father seems more than a little worried that the new machinery is not worth the cost and that Erica's motivations may not be based on sound financial decision making. As Erica looked over the financial forecasts, market data, line of credit agreement, and the intimidating $350,000 invoice that would soon follow, she wondered how she could convince her father, and herself, that purchasing the new oven would be a sound financial decision. ber Oo to do Exhibit 2. Free cash flow worksheet 3 4 5 6 0 Working Capital Calculations N Working Capital (Non-Cash CA less CL) Change in working capital Projected Free Cash Flows to the Project Net Income Depreciation Amortization Change in working capital (from above) Capital Expenditures Salvage value (Terminal Value) Free Cash Flows Sunrise Bakery Assumptions Expected Investment Cost Risk Free Rate Market Beta Equity Risk Premium Cost of Debt Cost of Equity Tax rate Debt / (Equity+Debt) WACC $350,000 3.00% 0.80 5.50% 4.50% 7.40% 30% 25% 0 Year Income statement (all figures are incremental) Revenue (Sales) Production Costs Depreciation / Amortization Profit Before tax Taxes Profit after tax (Net Income) 1 $135,000 ($20,000) ($35,000 $80,000 ($24,000) $56,000 2 $145,000 ($22,000) ($35,000) $88,000 ($26.400) $61,600 1 0 SO $15,000 $91,675 $17,025 2 $ 188,325 $17,175 Projected Balance Sheet Cash and Marketable Sec Other Current Assets (Inventory and Receivables) Fixed Assets At cost Accumulated Depreciation / Amortization Net Fixed Assets Total Assets $350,000 $0 $350,000 $365,000 $350,000 $35,000 $315,000 $423.700 $350,000 $70,000 $280,000 $485,500 Current Liabilities (Payables) LT Debt Total Liabilities Stock and accumulated retained earnings Total Liabilities and Equity $0 $0 $0 $365,000 $365,000 $2,700 $0 $2,700 $421,000 $423,700 $2,900 $0 $2,900 $482,600 $485,500 Working Capital (Non-Cash Current Assets less Current Liabilities) Change in working capital Projected Free Cash Flows to the Project Net Income Depreciation / Amortization Change in working capital Capital Expenditures (fixed assets at cost) After tax salvage value Terminal Value) Free Cash Flows Sunrise Bakery sumptions xpected Investment Cost isk Free Rate Tarket Beta quity Risk Premium cost of Debt Cost of Equity ex rate Debt/Equity Debo VACC SLOOOO 3.00% 5.50% 250% 7.40 30% Year income statement (all figures are incremental) Revenue (Sales) Production Costs Depreciation / Amortization Profit Before tax Taxes Profit arter tax (Net Income) 1 $135,000 (520,000) $35 000 $80,000 $24.000 $56,000 2 3145.000 (522,000) (535.000 $88,000 (548.400 $61,600 3 6 $156,000 $100,000 $765,000 $165.000 (524,000) (525.000) (525.000) (526,000) $35.000 (335.000.000 $35.000) 596,000 $104.000 5104.000 $104,000 5:28.800531200831200831200 567/200 $12.800 $72.800 5727800 30 $15,000 1 $91.675 $17.025 2 $168325 $17,175 3 5 6 $290,575 $398,425 $506 225 5614,025 $17,325 $17.475 $17.475 $17,475 Projected Balance Sheet Cash and Marketable Sec Other Current Assets (Inventory and Receivable) Fixed Assets Al cost Accumulated Depreciation / Amortization Net Foxed Assets Total Assets $350,000 $0 5360 DOO $385.000 $350,000 $35.000 3315.000 3423.700 $350.000 $70,000 5280,000 $485 500 $350,000 $350,000 $350,000 $350,000 $105 000 $140,000 $175,000 $210,000 5245.000 $210.000 $175,000 $140.000 $562.500 5625.000 3868,700 5771.500 Current Liabilities (Payables) LT Debt Total Liabities Stock and could retained earings Total Unities and Equity 50 $0 $0 $365.000 5966000 52.700 $0 $2,700 $421 000 $423700 $2,900 50 $2,900 S4A2,500 5485,500 53.100 $3,300 $3,300 $3,300 SO SO 50 $3,100 $3,300 $3,300 $3,300 $549 800 $822 600 5895 400 5768 200 5562,500 $825,900 5690 700 771.500 Working Capital (Non-Cash Current Assets loss Current Liabilities) Change in working capital Projected Free Cash Flows to the Project Net Income Depreciation / Amortization Change in working capital Capital Expenditures (foued assets Cost) Afer tax salvege value Terminal Value) Free Cash Flows IRR Does this beat the WACC? NPV analysis using the WACC) PViCash How Discount rate Payback Analysis (when do cash flows sum positive) Return on invested capital Average forecasted profit net income) Average capital invested and assets) ROTROS Sunrise Bakery Assumptions Expected Investment Cost Risk Free Rate Market Beta Equity Risk Premium Cost of Debt Cost of Equity Tax rate Debt / (Equity+Debt) WACC $350,000 3.00% 0.80 5.50% 4.50% 7.40% 30% 25% Year Income statement (all figures are incremental) Revenue (Sales) Production Costs Depreciation / Amortization Profit Before tax DO2389 Taxes Profit after tax (Net Income $1 ($ ($3 006 90 ($2 O $0 $15,000 $ $1 Projected Balance Sheet Cash and Marketable Sec. Other Current Assets (Inventory and Receivables) Fixed Assets At cost Accumulated Depreciation / Amortization Net Fixed Assets Total Assets $350,000 $0 $350,000 $365,000 $35 $3 $31 $42 $ $o $0 $0 $365,000 $365,000 $ $42 $423 Current Liabilities (Payables) LT Debt Total Liabilities Stock and accumulated retained earnings Total Liabilities and Equity Working Capital (Non-Cash Current Assets less Current Liabilities) Change in working capital Projected Free Cash Flows to the Project Net Income Depreciation / Amortization Change in working capital Capital Expenditures (fixed assets at cost) After tax salvage value Terminal Value) Free Cash Flows $350,000 3.00% 0.80 5.50% 4.50% 7.40% 30% 25% 0 1 $135,000 ($20,000) ($35,000) $80,000 ($24,000) $56,000 2 $145,000 ($22,000) ($35,000) $88,000 ($26,400) $61,600 3 5 $155,000 $165,000 $165,000 $165,000 ($24,000) ($26,000) ($26,000) ($26,000) ($35,000) ($35.000 ($35,000) ($35,000) $96,000 $104,000 $104,000 $104,000 ($28,800) ($31,200) ($31,200) ($31, 200) $67,200 $72,800 $72,800 $72,800 0 $0 $15,000 1 $91,675 $17,025 2 $188,325 $17,175 3 4 5 6 $290,575 $398,425 $506,225 $614,025 $17,325 $17,475 $17,475 $17,475 $350,000 $0 $350,000 $365,000 $350,000 $35,000 $315,000 $423,700 $350,000 $70,000 $280,000 $485,500 $350,000 $350,000 $350,000 $350,000 $105,000 $140.000 $175,000 $210,000 $245,000 $210,000 $175,000 $140,000 $552,900 $625,900 $698,700 $771.500 $0 $0 $0 $365,000 $365,000 $2,700 $O $2,700 $421,000 $423,700 $2,900 $0 $2,900 $482 600 $485,500 $3,100 $3,300 $3,300 $3,300 $0 $0 $0 $0 $3,100 $3,300 $3,300 $3,300 $549,800 $622,600 $695,400 $768,200 $552,900 $625,900 $698,700 $771,500 iabilities) Does this beat the WACC? 2 5 Sunrise Bakery Assumptions Expected investment Cost Risk Free Rate Market Beta Equity Risk Premium Cost of Debt Cost of Equity Tax rate Debt / (Equity Den WACO $350,000 3.00 0.80 5.60% 4.50% 7.40% 30% Year Income statement all figures are incremental) Revenue (Sales) Production Costs Depreciation / Amortization Profit Before tax Taxes Profiter (Net income $135,000 (520,000) 1$35,000 $80,000 1524.000) 550.000 2 $145,000 (522,000) $35.000 $88.000 525.400 $61,600 3 $155,000 3165,000 $165.000 $165,000 (524,000) ($20,000) (526,000) (526,000) $35.000 $35.000 (535.000) (535 000) 596.000 $104,000 $104,000 $104.000 ($28.800531,200 $31200831 200 $67200 S72300 $72.800 $72,800 $0 $15,000 $91,675 $17,025 2 $188,325 $17,175 Projected Balance Sheet Cash and Marketable Sec Other Current Assets (Inventory and Receivables) Fixed Assets Al cost Acumulated Depreciation Amortization Not Fixed Assets Total Assets 3 4 5 6 $290,575 333,425 $506 225 5614,025 $17,325 $17.475 $17.475 $17,475 $350,000 30 $350.000 $35.000 $350,000 $35.000 $315.000 3423,700 $350.000 $70,000 $280.000 5485,500 $350,000 $350,000 $350,000 $350,000 5105000 5140 000 $175,000 $210 000 $245 000 $210 000 $175,000 $140,000 3562300 $825.9003698.700 577/1,500 $0 50 $0 $365.000 $365.000 52,700 50 $2.700 $421.000 $423 700 $2.000 30 52.900 $482.600 3486,500 $3,100 $3,300 $3,300 $3,300 SO SO $0 $0 $3,100 $3,300 $3,300 $3,300 $549,800 $622,600 $695,400 $788200 36627.00 $625000 $398 700 5771,800 Current Liabilities ( Payables) LT Debt Totabilities Stock and accumulated retained earnings Total abilities and Equity Working Capital (Non-Cash Current Assets loss Current Liabies) Change in working capital Projected Free Cash Flows to the Project The income Depreciation / Amortization Change in working capital Capital Expenditures freed assets atos Ahor tax salvage valus Terminal Value Free Cash Flows Does this beat the WACC? IRR NPV analysis using the WACC) Prvi Cashow Discount rate INPV Payback Analysis (when do cash flows sum positive) Return on invested capital Average forecasted profit net income Average capital invested netfand assets) ROROC Exhibit 1. Financial Statements for Sunrise Bakery 0 Income statement (all figures are incremental) Revenue (Sales) Production Costs Depreciation / Amortization Profit Before tax Taxes Profit after tax (Net Income 1 2 3 $135,000 $145,000 $155,000 $165,000 $165,000 $165,000 ($20,000) ($22,000) ($24,000) ($26,000) ($26,000) ($26,000) ($35,000) ($35,000) ($35,000) ($35,000) ($35,000) ($35,000) $80,000 $88,000 $96,000 $104,000 $104,000 $104,000 ($24,000) ($26,400) ($28,800) ($31,200) ($31,200) ($31,200) $56,000 $61,600 $67,200 $72,800 $72,800 $72,800 0 $0 $15,000 $91,675 $17,025 2 $188,325 $17,175 3 $290,575 $17,325 4 5 $398,425 $506,225 $17,475 $17,475 6 $614,025 $17,475 Projected Balance Sheet Cash and Marketable Sec. Other Current Assets (Inventory/Receivables) Fixed Assets At cost Accumulated Depreciation / Amortization Net Fixed Assets Total Assets $350,000 $0 $350,000 $365,000 $350,000 $350,000 $350,000 $350,000 $350,000 $350,000 $35,000 $70,000 $105,000 $140,000 $175,000 $210,000 $315,000 $280,000 $245,000 $210,000 $175,000 $140,000 $423,700 $485,500 $552,900 $625,900 $698,700 $771,500 Current liabilities (Payables) LT Debt Total liabilities Stock And accumulated retained earnings Total liabilities and equity $0 $0 $0 $365,000 $365.000 $2,700 $2,900 $0 $0 $2,700 $2,900 $421,000 $482,600 $423,700 $485,500 $3,100 $0 $3,100 $549,800 $552.900 $3,300 $0 $3,300 $622,600 $625,900 $3,300 $0 $3,300 $695,400 $698,700 $3,300 $0 $3,300 $768,200 $771,500 Capstone Case: Sunrise Bakery Expansion and TO SVOM The Sunrise Bakery Corporation was originally founded in Houston, TX in 1991 by Griffin Harris, who currently serves as the company's Chief Executive Officer. About four years ago, Griffin's daughter, Erica, moved into the company to serve as Chief Financial Officer. Erica had graduated from college a few years ago and had worked for a few years in retail. However, for the past two years, she had been working quite successfully on an online accounting degree, but she still felt a little uncomfortable in her new role as CFO of the family business. bor Sunrise produces and markets a variety of bakery products throughout southeast Texas and Louisiana. They operate mostly through warehouse delivery and produce fresh breads, buns, rolls, and snack cakes under a few of their own regional brands but also including some licensed "big name" national brands. In total, they operate five bakeries with one very large facility and four smaller production sites. For the past three years, sales have averaged about $15 Million, generating about $650 Thousand in Net Income per year. However, sales have been roughly flat for the past six years as growth has slowed and production capacity has reached nearly 100%. In order to grow sales, Sunrise Bakery needs to invest in further production capacity. 01 od is Griffin Harris has been looking to purchase more space, build additional bakeries, or even perhaps acquire one of their smaller competitors, but nothing specific has worked out yet. Erica has an alternative short-term plan to modernize the production process at their main plant. Her idea involves the purchase of a new, significantly faster, integrated commercial oven that she recently saw displayed at a trade show. Few other bakeries in the region have invested in this modern equipment, and she expects it may cut costs and improve output efficiency. Her sales representative suggests the new oven could raise incremental sales at their large bakery by 15%. bodo Installation of the oven could be mostly executed over the upcoming Labor-day long weekend and shouldn't disrupt sales or production too much. However, the new oven requires an expenditure of $350,000, which would be a large capital expenditure for Sunrise. To reflect the wear and tear on the oven, tax law allows for a 10% annual reduction in the value of the oven as a depreciation expense. That is, Erica's financial forecast includes a non-cash expense of $35,000 for each of the next six years. After six years, Erica's sales representative expects the oven to be worth about $140,000, which is just equal to the accounting book value of the oven after six years of accumulated depreciation (S140,000 = $350,000 -6. 10%*$350,000). Operation of the oven also requires a small initial investment in an inventory of spare parts of $15,000. The inventory should be fully recoverable for $15,000 if the machine is sold. The investment in inventory represents an increase in other current assets (inventory) that should be included as a change in working capital requirements for Sunrise Bakery. Sunrise estimates receivables at 1.5% of revenues and payables at 2% of revenues each year. At the end of the project, Erica expects to recover all of the working capital invested in the project. In other words, she expects a cash flow equal to the amount of Non-Cash Current Assets less Current Liabilities in the last year of the project. Erica's financial forecast for the new oven does not require any significant change in financing. Sunrise started with one small bakery entirely paid for with cash from Griffin Harris and a mortgage on the bakery property. Currently, Sunrise maintains a rough capital structure of about 25% debt and 75% equity. In Erica's forecast, she expects to purchase the new oven with available cash and retained earnings (Sunrise's own money) and without any additional drawdown on their bank line of credit (no new debt). Sunrise currently pays about 4.5% on their debt, and that rate is not expected to change with the additional purchase of the oven. No additional external financing should be needed, and after discussions with her loan office, Erica expects the bank will approve the purchase of the oven without any effect on their line of credit. Overall, the cash purchase of the oven is not expected to change the capital structure of the Sunrise Corporation. However, since the oven will become part of the assets of Sunrise, the bank could seize the oven should Sunrise fail to make payments on their current debt. Erica remembered from her online classes that she needs to assess the risk of her business when making important financial decisions. In rescarching similar large public bakery and other food manufacturers, she found that firms in her industry with about the same level of risk mostly had stock market betas around 0.80 on average. She also noted that many analysts used a ballpark equity risk premium of 5.5% and a current yield on U.S. treasury bonds (risk-free rate) of about 3%. Sunrise has a corporate tax rate of 30% To help understand the costs and benefits of the decision, Erica worked closely with her director of operations, plant manager, marketing team, and her father to produce some realistic sales, costs, and financial forecasts. Her team felt uncomfortable forecasting more than 5 or 6 years into the future. Her focus was on how the new oven might improve incremental revenue generation at their large plant. The case exhibits below contain Erica's financial projections for the project. In discussing her plan to purchase the new oven, Erica's father seems more than a little worried that the new machinery is not worth the cost and that Erica's motivations may not be based on sound financial decision making. As Erica looked over the financial forecasts, market data, line of credit agreement, and the intimidating $350,000 invoice that would soon follow, she wondered how she could convince her father, and herself, that purchasing the new oven would be a sound financial decision. ber Oo to do Exhibit 2. Free cash flow worksheet 3 4 5 6 0 Working Capital Calculations N Working Capital (Non-Cash CA less CL) Change in working capital Projected Free Cash Flows to the Project Net Income Depreciation Amortization Change in working capital (from above) Capital Expenditures Salvage value (Terminal Value) Free Cash Flows
Step by Step Solution
There are 3 Steps involved in it

Get step-by-step solutions from verified subject matter experts