

Question: Need help with formulas for bottom two tables. I believe the calculations in the middle two tables are correct (top table is given), but not
Need help with formulas for bottom two tables. I believe the calculations in the middle two tables are correct (top table is given), but not 100% sure. Correct answers for bottom two are off to the right side. Will thumbs up if answered. Thanks :)
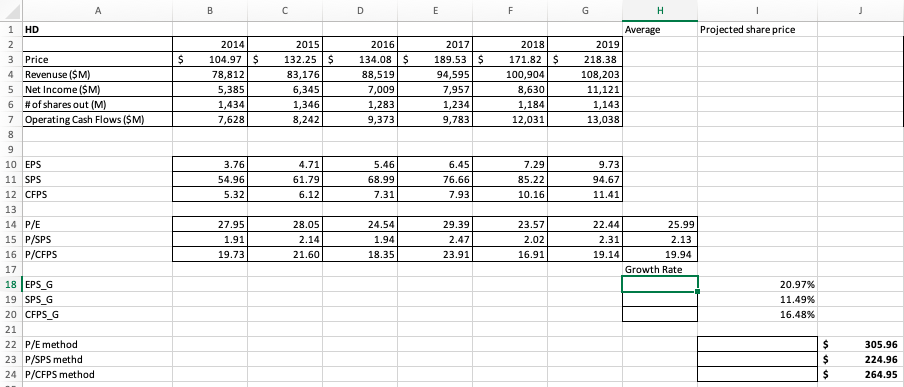
B D E F G H Projected share price $ 2014 104.97 $ 78,812 5,385 1,434 7,628 2015 132.25 $ 83,176 6,345 1,346 8,242 2016 134.08$ 88,519 7,009 1,283 9,373 2017 189.53 $ 94,595 7,957 1,234 9,783 2018 171.82 $ 100,904 8,630 1,184 12,031 Average 2019 218.38 108,203 11,121 1,143 13,038 3.76 54.96 5.32 4.71 61.79 6.12 5.46 68.99 7.31 6.45 76.66 7.93 7.29 85.22 10.16 9.73 94.67 11.41 1 HD 2 3 Price 4 Revenuse (SM) 5 Net Income (SM) 6 # of shares out (M) 7 Operating Cash Flows ($M) 8 9 10 EPS 11 SPS 12 CFPS 13 14 P/E 15 P/SPS 16 P/CFPS 17 18 EPS_G 19 SPSG 20 CFPS_G 21 22 P/E method 23 P/SPS methd 24 P/CFPS method 27.95 1.91 19.73 28.05 2.14 21.60 24.54 1.94 18.35 29.39 2.47 23.91 23.57 2.02 16.91 22.44 2.31 19.14 25.99 2.13 19.94 Growth Rate 20.97% 11.49% 16.48% $ $ $ 305.96 224.96 264.95
Step by Step Solution
There are 3 Steps involved in it

Get step-by-step solutions from verified subject matter experts