

Question: Need Help with Grade 11 Functions (Exponential Functions) Practice Questions 2. Graph the data from page 1. hand drawn 3. Is the table of values
Need Help with Grade 11 Functions (Exponential Functions) Practice Questions
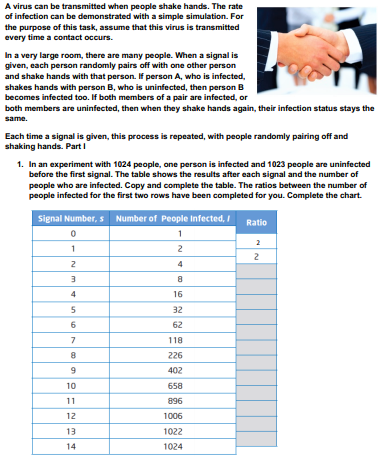
2. Graph the data from page 1. hand drawn 3. Is the table of values is best described by a linear, quadratic or exponential function? Explain. 4. Write an equation for this function. Identify the following features of your function: a) The growth rate b) The initial value c) The exponent d) Vertical asymptote (if any) e) Horizontal asymptote (if any) f) x and y intercepts (if any) g) The domain and range h) Can you think of any factors that might lead to restrictions on the domain and range of this model? i) Over what domain and range does the model representing the spread of infection approximately fit an exponential function? 5. Does the number of people infected grow exponentially until everyone in the room is infected? Provide a reasonable explanation and include data from the table to support your answer. 6. What will happen to your graph in part 1, if each person shakes hand with 2 other persons instead of one? Explain. 7. What will happen to your graph in part 1, if initially there are 5 persons infected? Explain. 8. Create your own realistic relationship that can be modelled by an exponential function, and provide the following: a) The equation of the exponential function with the meaning of each variable b) Write a realistic word problem where your equation could be used to solve the problem c) An algebraic and graphical solution to your problem based on your equation of the exponential functionA virus can be transmitted when people shake hands. The rate of infection can be demonstrated with a simple simulation. For the purpose of this task, assume that this virus is transmitted every time a contact occurs. In a very large room, there are many people. When a signal is given, each person randomly pairs off with one other person and shake hands with that person. If person A, who is infected, shakes hands with person B, who is uninfected, then person B becomes infected too. If both members of a pair are infected, or both members are uninfected, then when they shake hands again, their infection status stays the same. Each time a signal is given, this process is repeated, with people randomly pairing off and shaking hands. Part I 1. In an experiment with 1024 people, one person is infected and 1023 people are uninfected before the first signal. The table shows the results after each signal and the number of people who are infected. Copy and complete the table. The ratios between the number of people infected for the first two rows have been completed for you. Complete the chart. Signal Number, $ Number of People Infected, I Ratio 1 2 4 4 16 ZE 62 118 226 402 10 658 11 896 12 1006 13 1022 14 1024
Step by Step Solution
There are 3 Steps involved in it

Get step-by-step solutions from verified subject matter experts