

Question: Need help with homework Elasticity - End of Chapter Problem In the United States, 2018 was a bad year for growing wheat. As the wheat
Need help with homework
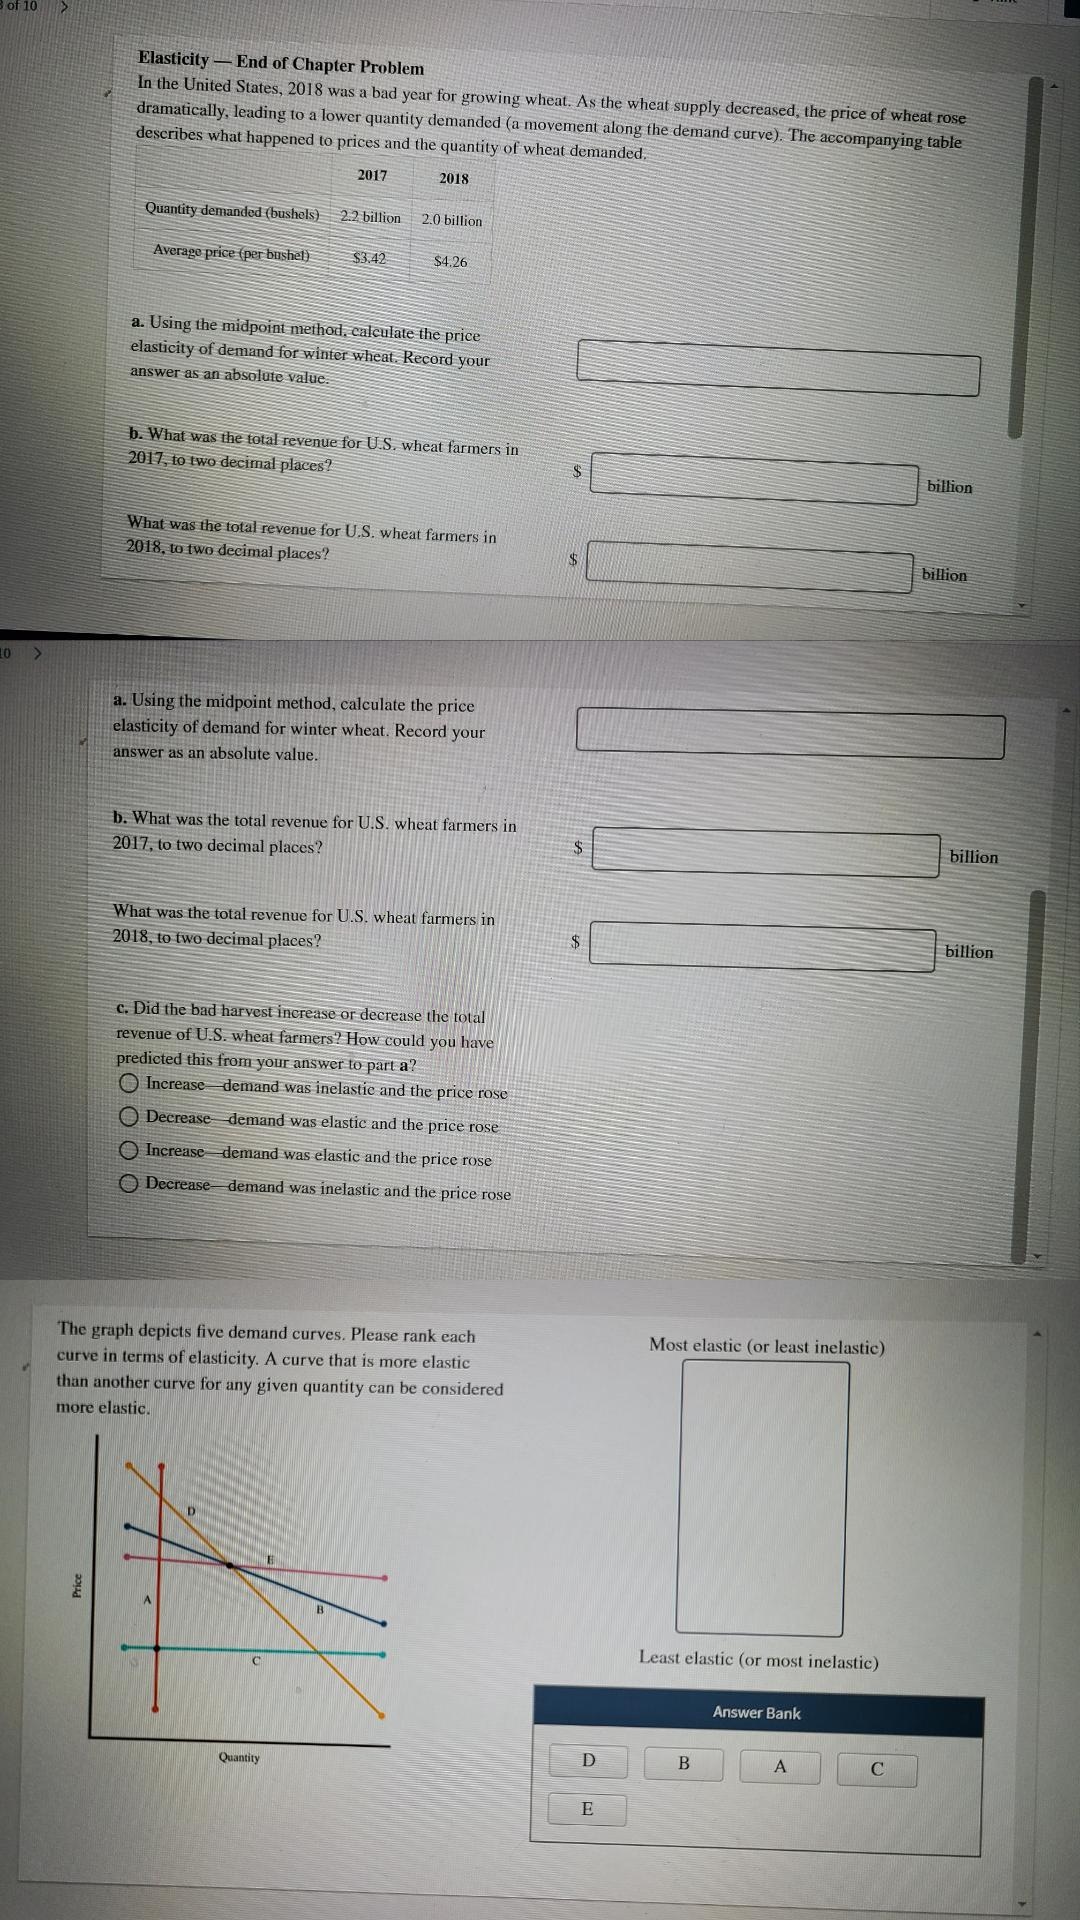
Elasticity - End of Chapter Problem In the United States, 2018 was a bad year for growing wheat. As the wheat supply decreased, the price of wheat rose dramatically, leading to a lower quantity demanded (a movement along the demand curve). The accompanying table describes what happened to prices and the quantity of wheat demanded. 2017 2018 Quantity demanded (bushels) 2.2 billion 2.0 billion Average price (per bushel) $3.42 $4.26 a. Using the midpoint method. calculate the price elasticity of demand for winter wheat. Record your answer as an absolute value. b. What was the total revenue for U.S. wheat farmers in 2017, to two decimal places billion What was the total revenue for U.S. wheat farmers in 2018, to two decimal places? billion a. Using the midpoint method, calculate the price elasticity of demand for winter wheat. Record your answer as an absolute value. b. What was the total revenue for U.S. wheat farmers in billion 2017, to two decimal places? What was the total revenue for U.S. wheat farmers in billion 2018, to two decimal places? C. Did the bad harvest increase or decrease the total revenue of U.S. wheat farmers? How could you have predicted this from your answer to part a? Increase demand was inelastic and the price rose Decrease demand was elastic and the price rose Increase demand was elastic and the price rose Decrease demand was inelastic and the price rose The graph depicts five demand curves. Please rank each Most elastic (or least inelastic) curve in terms of elasticity. A curve that is more elastic than another curve for any given quantity can be considered more elastic. Price Least elastic (or most inelastic) Answer Bank D B A C Quantity E
Step by Step Solution
There are 3 Steps involved in it

Get step-by-step solutions from verified subject matter experts