

Question: Need help with making the graph like it is in the correct_output.txt here is a snippet of my code // Prints a scaled bar relevant
Need help with making the graph like it is in the correct_output.txt
here is a snippet of my code // Prints a scaled bar relevant to the maximum value in the samples array void printBar(int val, int max) { int i; int barlength = GRAPH_WIDTH * val / max; cout // Prints a graph comparing the sample values visually graph.cpp #include "graph.h" using namespace std; namespace seneca { // Fills the samples array with the statistic samples // Finds the largest sample in the samples array, if it is larger than GRAPH_WIDTH, // Prints a scaled bar relevant to the maximum value in the samples array } // namespace seneca namespace seneca { // Function prototypes for graph module } // namespace seneca #endif // SENECA_GRAPH_H io.cpp using namespace std; namespace seneca { // Prints an integer value with a specified field width // Returns the number of digits in an integer // Performs a fool-proof integer entry // Moves the cursor backward // Displays the user interface menu return getInt(0, 3); // Draws a line and adds a label // Draws a line } // namespace seneca #ifndef SENECA_IO_H namespace seneca { // Function prototypes for io module } // namespace seneca #endif // SENECA_IO_H #include "io.h" using namespace std;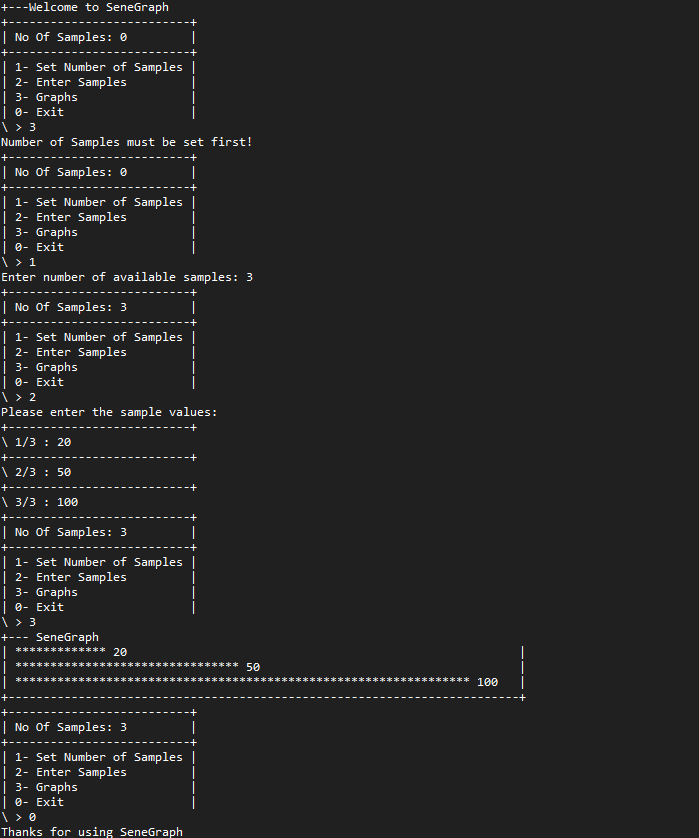
void printGraph(int samples[], int noOfSamples, const char* label) {
int max = findMax(samples, noOfSamples);
labelLine(GRAPH_WIDTH + 10, label);
for (int i = 0; i printBar(samples[i], max);
}
line(GRAPH_WIDTH + 10);
}
and here is the correct_output.txt and ss
+---Welcome to SeneGraph
+--------------------------+
| No Of Samples: 0 |
+--------------------------+
| 1- Set Number of Samples |
| 2- Enter Samples |
| 3- Graphs |
| 0- Exit |
\ > 3
Number of Samples must be set first!
+--------------------------+
| No Of Samples: 0 |
+--------------------------+
| 1- Set Number of Samples |
| 2- Enter Samples |
| 3- Graphs |
| 0- Exit |
\ > 1
Enter number of available samples: 3
+--------------------------+
| No Of Samples: 3 |
+--------------------------+
| 1- Set Number of Samples |
| 2- Enter Samples |
| 3- Graphs |
| 0- Exit |
\ > 2
Please enter the sample values:
+--------------------------+
\ 1/3 : 20
+--------------------------+
\ 2/3 : 50
+--------------------------+
\ 3/3 : 100
+--------------------------+
| No Of Samples: 3 |
+--------------------------+
| 1- Set Number of Samples |
| 2- Enter Samples |
| 3- Graphs |
| 0- Exit |
\ > 3
+--- SeneGraph
| ************* 20 |
| ******************************** 50 |
| ***************************************************************** 100 |
+-------------------------------------------------------------------------+
+--------------------------+
| No Of Samples: 3 |
+--------------------------+
| 1- Set Number of Samples |
| 2- Enter Samples |
| 3- Graphs |
| 0- Exit |
\ > 0
Thanks for using SeneGraph
and here is the whole set of code that I made with it
#include "io.h"
#include
void getSamples(int samples[], int noOfSamples) {
for (int i = 0; i line(28);
cout samples[i] = getInt(1, 1000000);
}
}
// otherwise, it will return GRAPH_WIDTH.
int findMax(int samples[], int noOfSamples) {
int max = samples[0];
for (int i = 1; i if (max }
return max }
void printBar(int val, int max) {
int i;
int barlength = GRAPH_WIDTH * val / max;
cout for (i = 0; i cout }
cout printInt(val, 0); // Print the sample value right next to the bar
cout }
// Prints a graph comparing the sample values visually
void printGraph(int samples[], int noOfSamples, const char* label) {
int max = findMax(samples, noOfSamples);
labelLine(GRAPH_WIDTH + 10, label);
for (int i = 0; i printBar(samples[i], max);
}
line(GRAPH_WIDTH + 10);
}
graph.h
#ifndef SENECA_GRAPH_H
#define SENECA_GRAPH_H
// Width of the graph
const int GRAPH_WIDTH = 65;
void getSamples(int samples[], int noOfSamples);
int findMax(int samples[], int noOfSamples);
void printBar(int val, int max);
void printGraph(int samples[], int noOfSamples, const char* label);
#include "io.h"
#include
#include
#include
void printInt(int value, int fieldWidth) {
cout }
int intDigits(int value) {
if (value == 0) return 1;
int count = 0;
while (value != 0) {
value /= 10;
++count;
}
return count;
}
int getInt(int min, int max) {
int val = min - 1;
bool done = false;
while (!done) {
std::cin >> val;
if (cin.fail() || val max) {
cin.clear(); // clear error flag
cin.ignore(std::numeric_limits<:streamsize>::max(), '\n'); // discard invalid input
cout }
else {
done = true;
}
}
return val;
}
void goBack(int n) {
for (int i = 0; i cout }
}
int menu(int noOfSamples) {
line(28);
cout printInt(noOfSamples, 1);
cout line(28);
cout cout cout cout cout /";
goBack(24);
}
void labelLine(int n, const char* label) {
cout for (int i = 0; i cout }
cout if (label) {
goBack(n - 4);
cout }
cout }
void line(int n) {
cout for (int i = 0; i cout }
cout cout }
io.h
#define SENECA_IO_H
void printInt(int value, int fieldWidth);
int intDigits(int value);
int getInt(int min, int max);
void goBack(int n);
int menu(int noOfSamples);
void labelLine(int n, const char* label);
void line(int n);
main.cpp
#include "graph.h"
#include
using namespace seneca;
// Maximum number of samples in an graph
const int MAX_NO_OF_SAMPLES = 20;
void samplesFirst();
// SeneGraph program
int main() {
int noOfSamples = 0;
int samples[MAX_NO_OF_SAMPLES] = { 0 };
bool done = false;
labelLine(33, "Welcome to SeneGraph");
while (!done) {
switch (menu(noOfSamples)) {
case 1:
cout noOfSamples = getInt(1, MAX_NO_OF_SAMPLES);
break;
case 2:
if (noOfSamples == 0) {
samplesFirst();
}
else {
cout getSamples(samples, noOfSamples);
}
break;
case 3:
if (noOfSamples == 0) {
samplesFirst();
}
else if (samples[0] == 0) {
cout }
else {
printGraph(samples, noOfSamples, " SeneGraph ");
}
break;
case 0:
cout done = true;
}
}
return 0;
}
// prints samples error message
void samplesFirst() {
cout }
+---Welcome to SeneGraph | No Of Samples: 0 1- Set Number of Samples 2- Enter Samples | 3- Graphs | 0- Exit \ > 3 Number of Samples must be set first! | No Of Samples: 1- Set Number of Samples 2- Enter Samples 3- Graphs | 0- Exit \ > 1 Enter number of available samples: 3 No of Samples: 3 | 1- Set Number of Samples 2- Enter Samples | 3- Graphs 0- \ > 2 Exit Please enter the sample values: \ 1/3 20 +--- \ 2/3 : 50 \ 3/3 : 100 | No Of Samples: 3 | 1- Set Number of Samples 2- Enter Samples 3- Graphs 0- Exit \ > 3 +--- SeneGraph ************* 20 ***********: | No Of Samples: 3 1- Set Number of Samples 2- Enter Samples | 3- Graphs | 0- Exit \ > 0 Thanks for using SeneGraph 50 100
Step by Step Solution
There are 3 Steps involved in it

Get step-by-step solutions from verified subject matter experts