

Question: Need help with part b. The table below shows hypothetical values, in billions of dollars, of different forms of money. 3. Use the table to
Need help with part b.
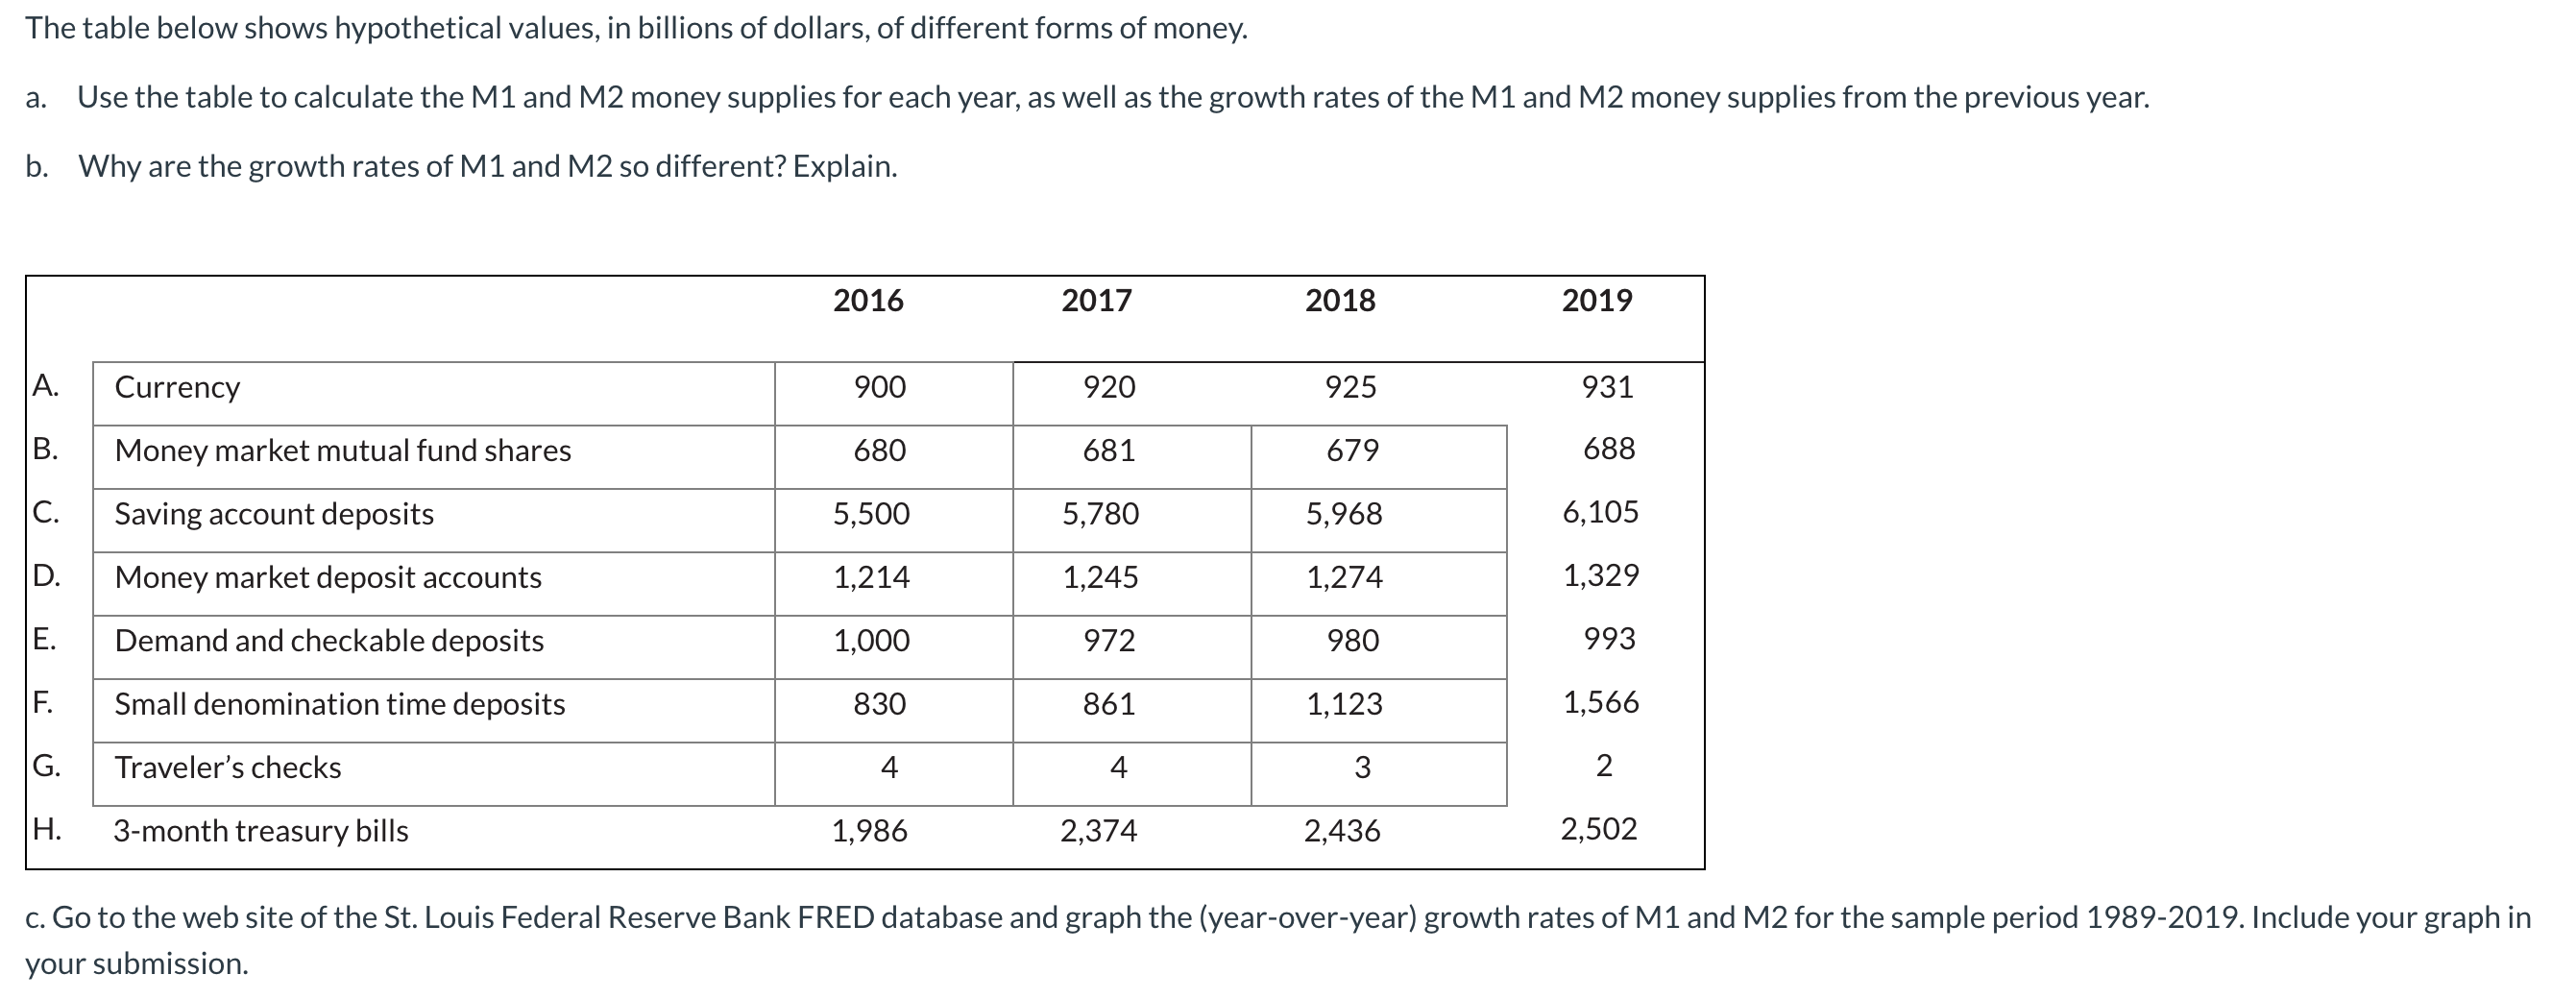
The table below shows hypothetical values, in billions of dollars, of different forms of money. 3. Use the table to calculate the M1 and M2 money supplies for each year, as well as the growth rates of the M1 and M2 money supplies from the previous year. b. Why are the growth rates of M1 and M2 so different? Explain. 2016 2017 2018 2019 A. Currency 900 920 925 931 B. Money market mutual fund shares 680 681 679 688 C. Saving account deposits 5,500 5,780 5,968 6,105 D. Money market deposit accounts 1,214 1,245 1,274 1,329 E. Demand and checkable deposits 1,000 972 980 993 F. Small denomination time deposits 830 861 1,123 1,566 G. Traveler's checks 4 4 3 2 H. 3month treasury bills 1,986 2,374 2,436 2,502 c. Go to the web site ofthe St, Louis Federal Reserve Bank FRED database and graph the (year-over-year) growth rates of M1 and M2 for the sample period 1989-2019. Include your graph in your submission
Step by Step Solution
There are 3 Steps involved in it

Get step-by-step solutions from verified subject matter experts