

Question: Need help with Part D please Group Assignment #1 For this assignment, please use excel file group_assignment_l_portfolios.xls posted on blackboard under the folder of Excel
 Need help with Part D please
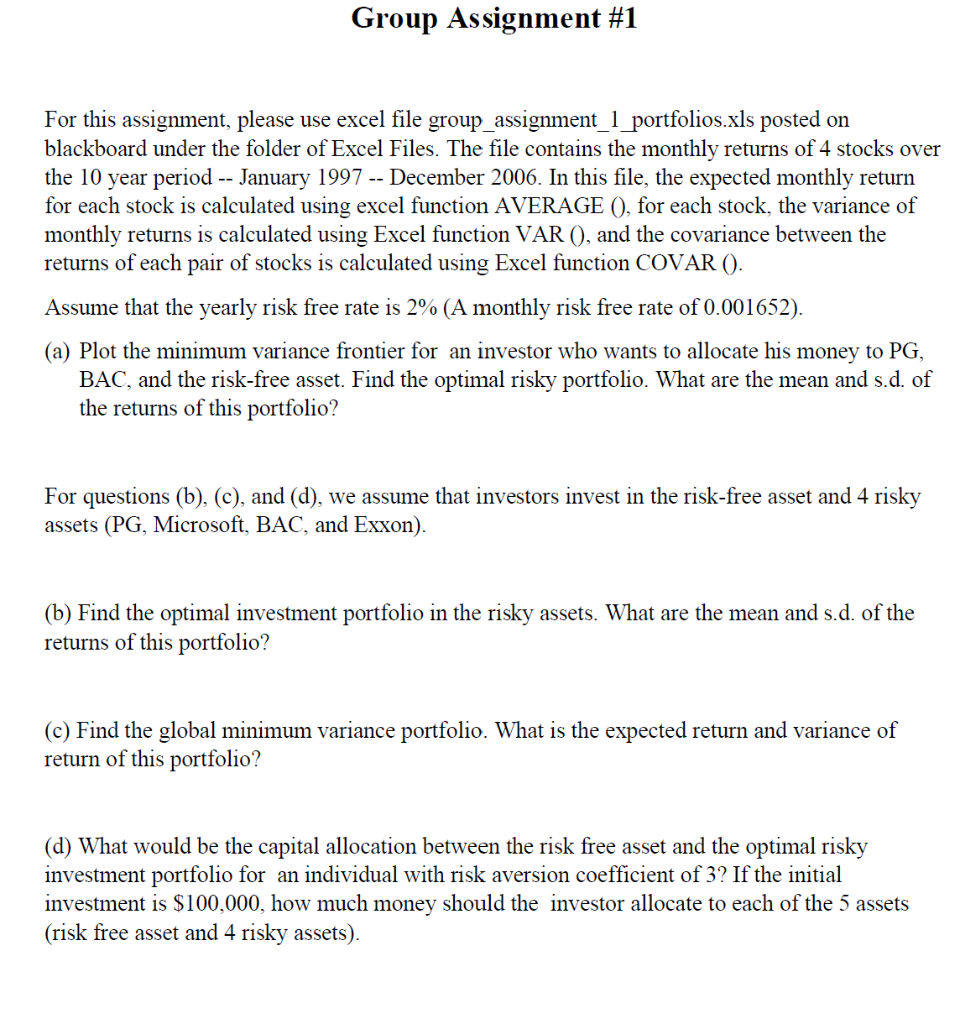
Group Assignment #1 For this assignment, please use excel file group_assignment_l_portfolios.xls posted on blackboard under the folder of Excel Files. The file contains the monthly returns of 4 stocks over the 10 year period -- January 1997 -- December 2006. In this file, the expected monthly return for each stock is calculated using excel function AVERAGE (), for each stock, the variance of monthly returns is calculated using Excel function VAR (), and the covariance between the returns of each pair of stocks is calculated using Excel function COVAR (). Assume that the yearly risk free rate is 2% (A monthly risk free rate of 0.001652). (a) Plot the minimum variance frontier for an investor who wants to allocate his money to PG, BAC, and the risk-free asset. Find the optimal risky portfolio. What are the mean and s.d. of the returns of this portfolio? For questions (b), (c), and (d), we assume that investors invest in the risk-free asset and 4 risky assets (PG, Microsoft, BAC, and Exxon). (b) Find the optimal investment portfolio in the risky assets. What are the mean and s.d. of the returns of this portfolio? (c) Find the global minimum variance portfolio. What is the expected return and variance of return of this portfolio? (d) What would be the capital allocation between the risk free asset and the optimal risky investment portfolio for an individual with risk aversion coefficient of 3? If the initial investment is $100,000, how much money should the investor allocate to each of the 5 assets (risk free asset and 4 risky assets). Group Assignment #1 For this assignment, please use excel file group_assignment_l_portfolios.xls posted on blackboard under the folder of Excel Files. The file contains the monthly returns of 4 stocks over the 10 year period -- January 1997 -- December 2006. In this file, the expected monthly return for each stock is calculated using excel function AVERAGE (), for each stock, the variance of monthly returns is calculated using Excel function VAR (), and the covariance between the returns of each pair of stocks is calculated using Excel function COVAR (). Assume that the yearly risk free rate is 2% (A monthly risk free rate of 0.001652). (a) Plot the minimum variance frontier for an investor who wants to allocate his money to PG, BAC, and the risk-free asset. Find the optimal risky portfolio. What are the mean and s.d. of the returns of this portfolio? For questions (b), (c), and (d), we assume that investors invest in the risk-free asset and 4 risky assets (PG, Microsoft, BAC, and Exxon). (b) Find the optimal investment portfolio in the risky assets. What are the mean and s.d. of the returns of this portfolio? (c) Find the global minimum variance portfolio. What is the expected return and variance of return of this portfolio? (d) What would be the capital allocation between the risk free asset and the optimal risky investment portfolio for an individual with risk aversion coefficient of 3? If the initial investment is $100,000, how much money should the investor allocate to each of the 5 assets (risk free asset and 4 risky assets)
Step by Step Solution
There are 3 Steps involved in it

Get step-by-step solutions from verified subject matter experts