

Question: Need help with part III. Queries for part II provided. Background You serve as a data analyst for IntegrateCo, a company that installs and services
Need help with part III. Queries for part II provided.
Background You serve as a data analyst for IntegrateCo, a company that installs and services integrated building management systems in the Intermountain West of the United States of America. Building management systems are computer-based systems installed in buildings to control all mechanical and electric equipment in the building. Examples of mechanical and electric equipment controlled by the building management system include lightning, air conditioning and heating, security systems, power systems, sound systems, video cameras, door-locking systems, etc. IntegrateCo serves both large and small customers. It is privately held and expects to have $15 million in revenue in 2016. The CFO, Noah Summers, noticed that payroll for the first six months of 2016 was approximately $266,000 more than in the first sixth months of 2015. Noah wants to know more why there was a difference and asked you to compare payroll for the first sixth months of 2016 with the first sixth months of 2015 and report to him what you find. One complication in performing this analysis is that IntegrateCo implemented a new accounting system at the start of 2016. Thus, the payroll data in 2015 and 2016 came from different systems. As a result, you will have to take great care to understand the data output from each system and appropriately combine the data for your analysis. ? In Part II, you will transform and load the data into Access, which you will use to analyze the data. ? In Part III, you will analyze and interpret the data and then a report for Noah. ? In Part IV, you will respond to follow-up questions asked by Noah after his initial review of your report.
File: Analytics_mindset_case_studies_jobcodes.csv This file lists different job codes within IntegrateCo. There are 12 different job codes, numbered 1 to 12, that are used to categorize employees' pay. Any job codes that are outside of this range are errors in the data. For managerial decision-making, the company assigns employees' pay to different job codes. That is, if Sally earned $100 working for five hours and she spent three hours on job code 1 (office), one-anda- half hours on job code 2 (sales) and a half hour on job code 8 (employee training), the company assigns $60 to job code 1, $30 to job code 2 and $10 to job code 8. The company lists job codes using two digits (01, instead of 1) to avoid any confusion and problems. As such, the data is, and should be, stored as text and the two-digit job code always should be used. File: Analytics_mindset_case_studies_2015payroll.csv This file contains the output of data from the first sixth months of 2015. Each row represents a unique employee and job code combination. From the example above about Sally, there would be three lines, one for each job code in the data. If Sally did the exact same amount and type of work in the next month, three more rows would be added. To figure out an employee's paycheck, you would sum all of the payments to an employee on a specific date. The rest of the data is defined as follows: Pay_Date: This is the date that the employee was paid. Payroll_ID: This is a unique identifier for the date that the payroll was run for all employees. Each unique date should have a unique Payroll_ID number. Emp_No: This is a unique identifier for each employee. These numbers are not reused so all employees have their own number. Home_Div: This is the division number to which each employee belongs. Work_Div: This is the work division number to which each employee belongs. First_Name: This is the first name of the employee being paid. Last_Name: This is the last name of the employee being paid. Job: This is a unique code that combines several pieces of information into one field. The first two numbers represent the year that the project began. So 14 means the project started in 2014. Then, sometimes, there is a department identifier (H or S) that is included. The next three digits represent the job code (e.g., 001, 010, 012). After the job code, sometimes there is a location code (B or SG). Here are several examples: ? 14005 - The 14 represents the year the project began and 005 represents the job code 005 (Installation). There is no department identifier or location code included. ? 15S002 - The 15 represents the year the project began, S represents the department and 002 represents the job code 002 (Sales). There is no location code included. ? 14S001SG - The 14 represents the year the project began, S represents the department, 001 represents the job code 001 (Office) and SG represents the location code. ? 15007B - The 15 represents the year the project began, 007 represents the job code 007 (Customer Train) and B represents the location code. There is no department identifier included.
Reg_Hrs: This is the number of regular hours reported by the employee that apply to the job code during the time period. OT_Hrs: This is the number of overtime hours reported by the employee that apply to the job code during the time period. Overtime hours are those worked in excess of 40 hours in a week. Reg_Pay: This is the amount of pay the employee received for the Reg_Hrs worked during the time period. This amount is for each job code. OT_Pay: This is the amount of overtime pay the employee received for the OT_Hrs worked during the time period. This amount is for each job code. Futa: This is the federal unemployment tax paid by the employer during the period. Suta: This is the state unemployment tax paid by the employer during the period. Fica_Medc: This is the tax removed for the Federal Insurance Contributions Act. This money is used to pay for Social Security and Medicaid. Work_Comp: This is the amount paid from employees' paychecks to cover workers' compensation insurance. File: Analytics_mindset_case_studies_2016payroll.csv This file contains the output of data from the first sixth months of 2016. The data contains no dates, so the data is such that each row represents a unique combination of the employee's name, project code, department identifier and location code. Thus, the 2016 data differs significantly from the 2015 data. The variables are defined as follows: Project: This is defined the same as Job in the 2015 data. Employee_ID: This is a new unique number created in the new database to recognize each unique employee. Employee_Number: This is defined the same as Emp_No in the 2015 data. Employee_Name: This is the combination of the First_Name and Last_Name fields in the 2015 data. Hours: This is defined the same as Reg_Hrs in the 2015 data. OT_Hours: This is defined the same as OT_Hrs in the 2015 data. Gross_Wages: This is defined as the sum of Reg_Pay and OT_Pay in the 2015 data. SocSec_Medicare: This is defined the same as Fica_Medc in the 2015 data. FUTA: This is defined the same as Futa in the 2015 data. SUTA: This is defined the same as Suta in the 2015 data. Work_Comp: This is defined the same as Work_Comp in the 2015 data.
Part II: Before you can perform your analysis, you must load the data into your data analytics tool. For this case, you can assume that Noah competently extracted all of the information from the two systems and that the pipe-delimited text file you were given is complete and accurate. Your responsibility is to load the data into Microsoft Access. Then, you will transform the data so that you can compare 2015 and 2016. While most students and business professionals are more comfortable using Excel than Access, there are three reasons why Access may be superior for this case. First, it will be easier to automate the analysis for reporting purposes if Access is used. By automating the analysis, Noah can run the analysis reports quickly and easily each month for the rest of 2016. Second, using Access makes it much easier for an internal or external auditor to review and re-perform the analysis. Third, Access can handle much greater volumes of data than Excel. If the company had more employees (e.g., from another division), then Excel may not be able to easily handle the additional data if it were a large data set. Required ? Load the data into Access. Below, are a few suggestions to keep in mind. - You should import the data into three different tables. One table should hold the 2015 data, another table should contain the 2016 data and the third table should include the job codes. Label these three tables as tbl_2015Data, tbl_2016Data and tbl_JobCodes, respectively. - Follow Access leading practices, including: ? As specified above, name the tables using the prefix tbl_ so it is easy to keep track of different item types in the database. ? Field names should not contain spaces. So, instead of using Customer Name as the field name, it should be CustomerName or Customer_Name. ? Special characters (e.g., $, &, %, ; or ,) should not be used in field names. ? Field names should be descriptive and provide some information about what the field includes. Abbreviations are acceptable to avoid long field names. ? Capitalization in the field names can enhance readability. Instead of acctnumber, the title AcctNumber is easier to understand. ? Once the data is loaded into Access, make the 2015 and 2016 data "talk together." That is, be aware that the different years of data are aggregated at different levels and you have to extract job code information to be able to compare the data between years. Consider the following: - Write one query that extracts the job code for 2015 and a second query that extracts the job code for 2016. In each query, include all of the other fields from the data import for each year; add a new field that has the extracted job code; and, for the 2015 data, add the employee's full name in the same format as it is listed in 2016. - Label the queries qry_2015WithCleanJobCode and qry_2016WithCleanJobCode for 2015 and 2016 data, respectively. - While there are multiple ways to extract the job code, one way to do it is using IIf, Mid and Like functions in a complex formula. As an additional hint, "Like "[A-Z]*"" will examine a character to see if it is a letter. Combining this function with an IIf statement can help you determine if different characters are letters. ? When you finish loading the data, upload a copy of your Access file for grading. Make sure you have written and saved the two queries suggested above to extract the job code information.
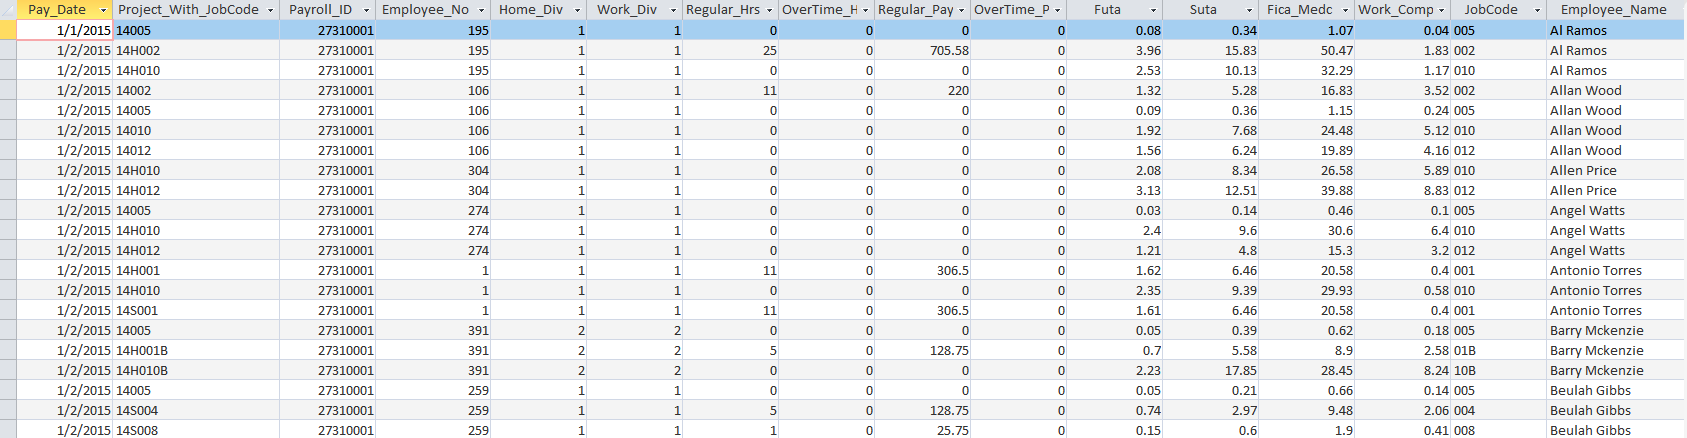
Here is my query for 2015 data which is saved as qry_2015WithCleanJobCode:
SELECT Pay_Date, Project_With_JobCode, Payroll_ID, Employee_No, Home_Div, Work_Div, Regular_Hrs, OverTime_Hrs, Regular_Pay, OverTime_Pay, Futa, Suta, Fica_Medc, Work_Comp, Right(Project_with_JobCode, 3) AS JobCode, First_Name & ' ' & Last_Name AS Employee_Name
FROM tbl_2015Data;
This is how the table looks like from the qry_2015WithCleanJobCode:
Step by Step Solution
There are 3 Steps involved in it

Get step-by-step solutions from verified subject matter experts