

Question: Need help with problem C. The first drop down is reject or do not reject and the second drop down is insufficient or sufficient thank
Need help with problem C. The first drop down is reject or do not reject and the second drop down is insufficient or sufficient thank you
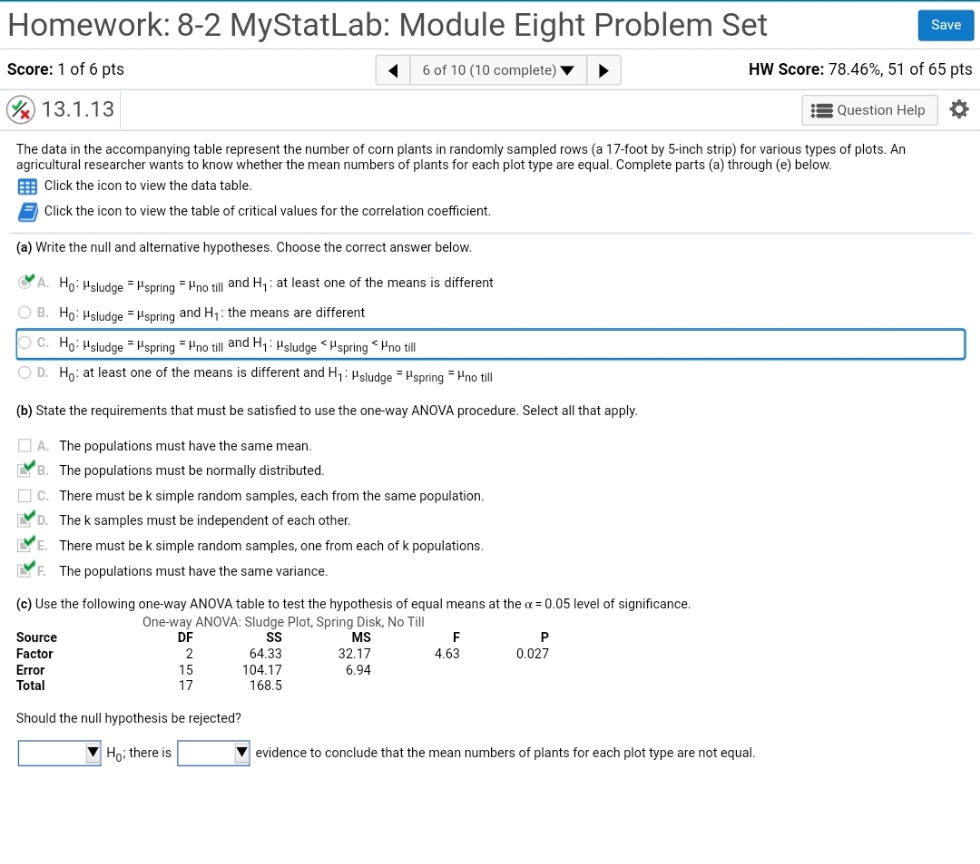
Homework: 8-2 MyStatLab: Module Eight Problem Set Score: 1 of 6 pts { e of10(1 complete) 7 p Hl Score: 78.46%, 51 of 65 pts 13.1 .13 E Question Help The data in the accompanying table represent the number of corn plants in randomlyI sampled rows [a 17-foot by 5-inch strip) for various types of plots. An agricultural researcher wants to know whether the mean nLI'nbers of plants for each plot type are equal. Complete parts (a) through (e) below. E Click the icon to View the data table. . Click the icon to View the table of critical values for the correlation coefcient. to) Write the null and alternative hypotheses. Choose the correct answer below. IVA. Ho: \"sludge = pspng = pm " and H1: at least one of the means is different ' E. H9: \"sludge =pspm19 and H1: the means are different ' HI): \"sludge = \"spring = "no tlll and H1 3 \"sludge ' \"spring ' i'no u'll 9:. I1 H0: at least one of the means is different and H1: \"sludge = owing = pm " (In) State the requirements that must be satised to use the onway ANO'U'A procedure. Select all that apply. I | A. The populations must have the same mean. left}. The populations must be normally distributed. [ | C. There must be It simple random samples. each irorn the same population. RV D. The R samples must be independent of each other. lg'E. There must be It simple random samples. one from each of k populations. lll'.' F. The populations must have the same variance. [cl Use the following onewatl ANO'M table to test the hypothesis oi equal means at the u = 0.05 level of signicance. (line-litre}.r ANOVA: Sludge Plot. Spring Disk. No Till Source DF 55 Ills F P Fault" 2 64.33 32.17 4.63 [H.123Ir Error 1 5 1 04.17 6.94 Total 1? 168. 5 Should the null hypothesis be rejected? E Ho; there is IE evidence to conclude that the mean numbers of plants for each plot type are not equal
Step by Step Solution
There are 3 Steps involved in it

Get step-by-step solutions from verified subject matter experts