

Question: Need help with problems posted. will have to manually input data due to tech issues. Moviegoer Spending on Snacks (n = 10) Age (X) ($)


Need help with problems posted. will have to manually input data due to tech issues.


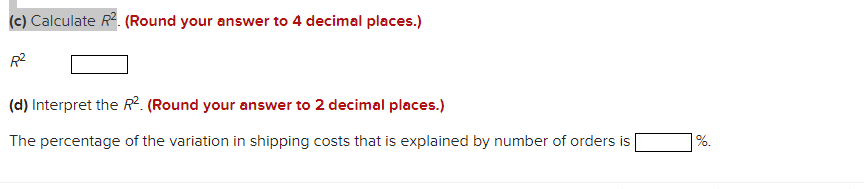


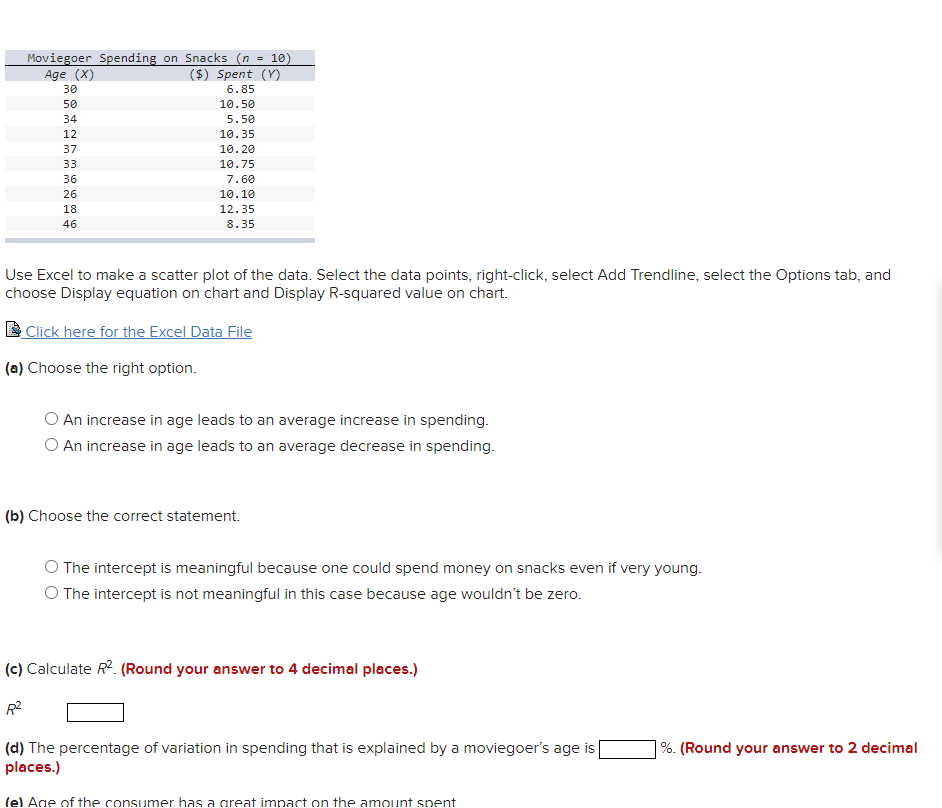
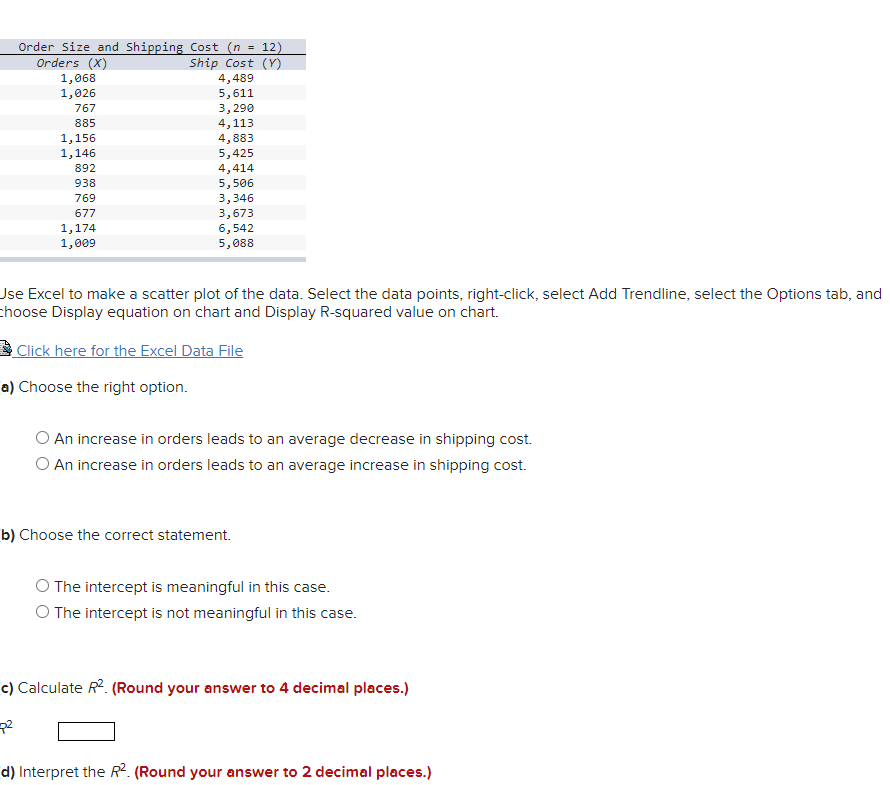
Moviegoer Spending on Snacks (n = 10) Age (X) ($) Spent (V) 36 6.85 50 10.50 34 5.50 12 10.35 37 10.20 33 10.75 36 7.60 26 10.10 18 12.35 46 8.35 Use Excel to make a scatter plot of the data. Select the data points, right-click, select Add Trendline, select the Options tab, and choose Display equation on chart and Display R-squared value on chart. Click here for the Excel Data File (a) Choose the right option. O An increase in age leads to an average increase in spending. O An increase in age leads to an average decrease in spending. (b) Choose the correct statement. O The intercept is meaningful because one could spend money on snacks even if very young. O The intercept is not meaningful in this case because age wouldn't be zero. (c) Calculate Rx. (Round your answer to 4 decimal places.) R2 (d) The percentage of variation in spending that is explained by a moviegoer's age is % (Round your answer to 2 decimal places.) (e)Order Size and ShiEping Cost {J1 = 12} Order's (X) Strip Cost (Y) 1,555 4,435 1,525 5,511 757 3,293 385 4,113 1,155 4,883 1,145 5,425 392 4,414 938 5,535 7'59 3,345 67"? 3,6?3 1,1?4 5,542 1,555 5,555 .Jse Excel to make a scatter plot ofthe data. Select the data points, right4:licl
Step by Step Solution
There are 3 Steps involved in it

Get step-by-step solutions from verified subject matter experts