

Question: need help with q7 DO IDEAS X Course Hero X + C V ideas.humber.ca/assess2/?cid=1017&aid=31039#/skip/7 X 250 points possible 11/16 answered O h . Question 7
need help with q7
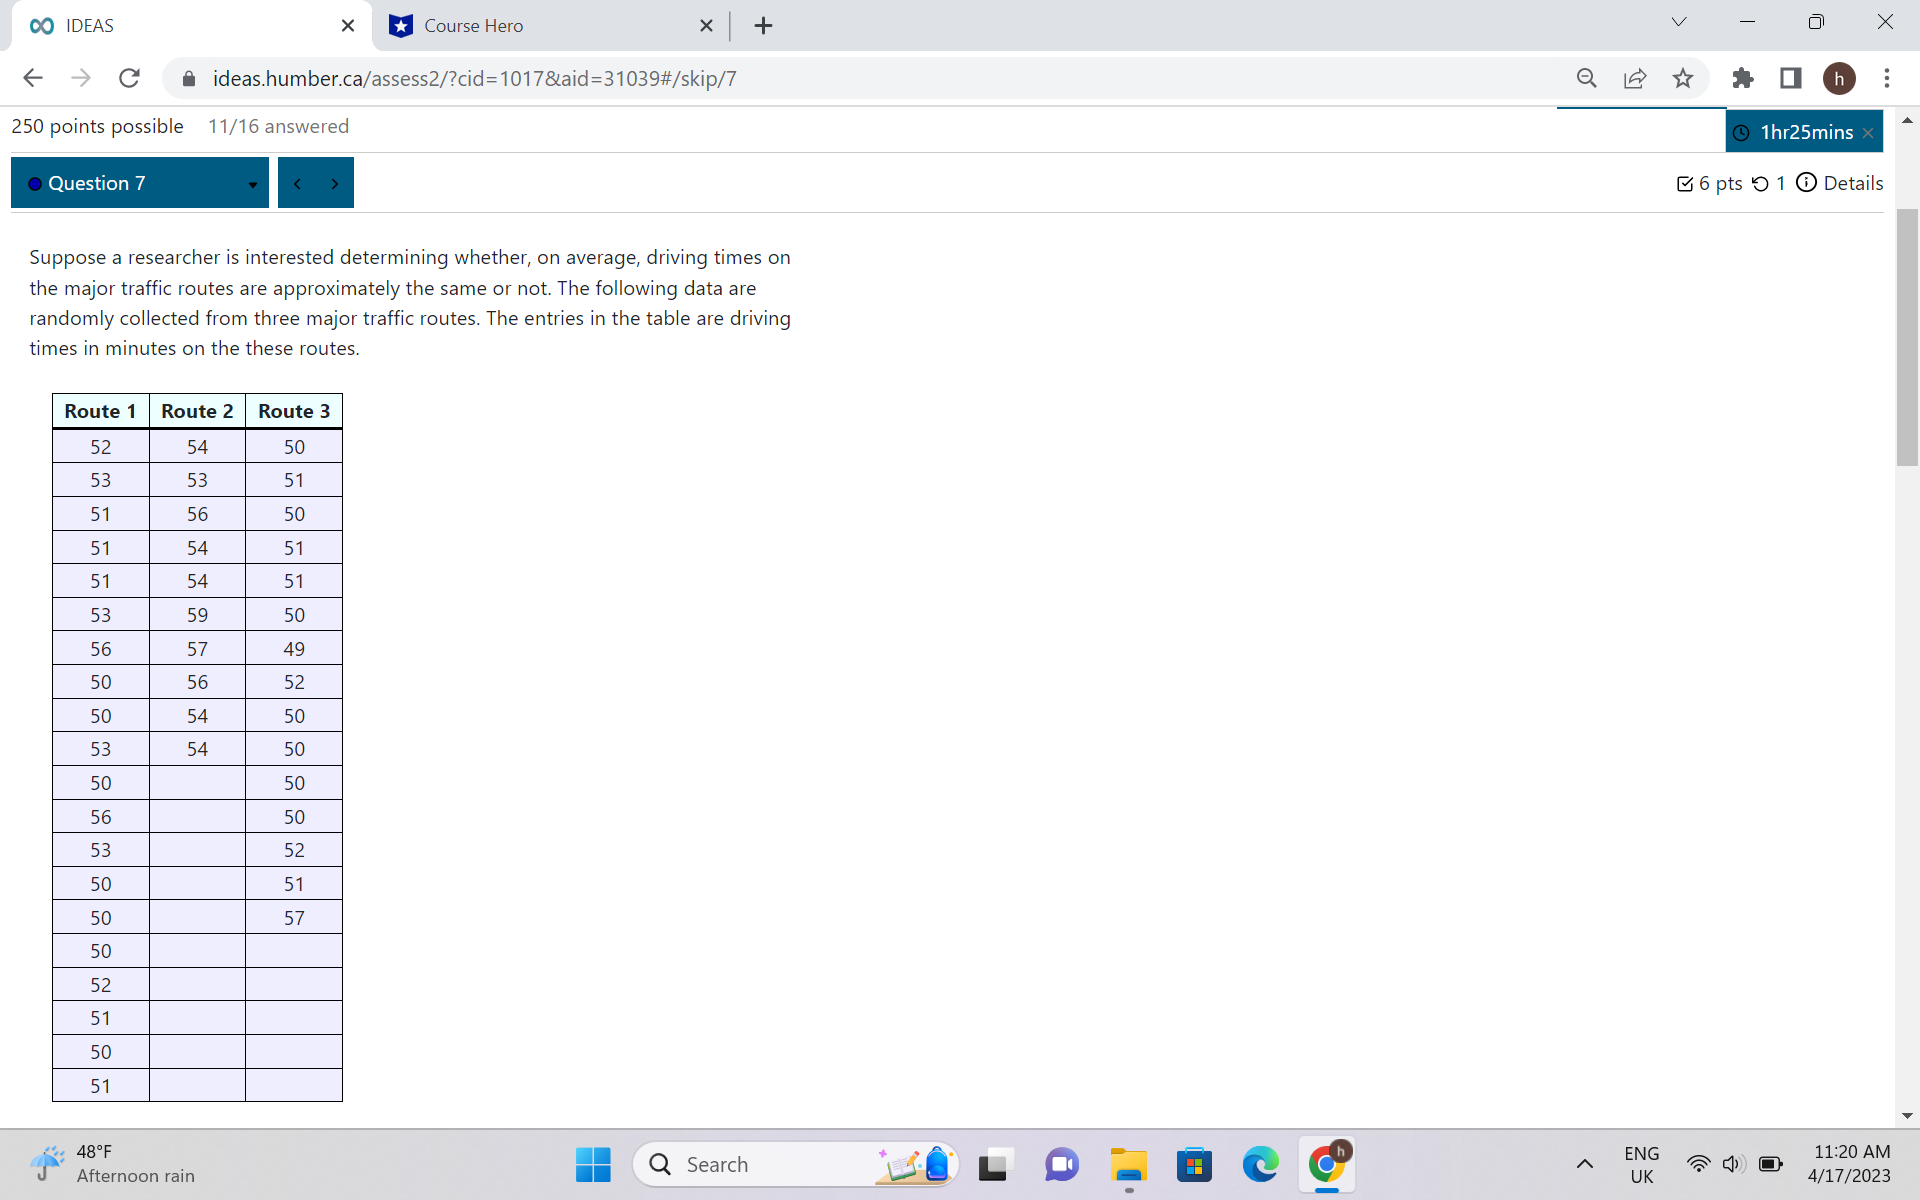
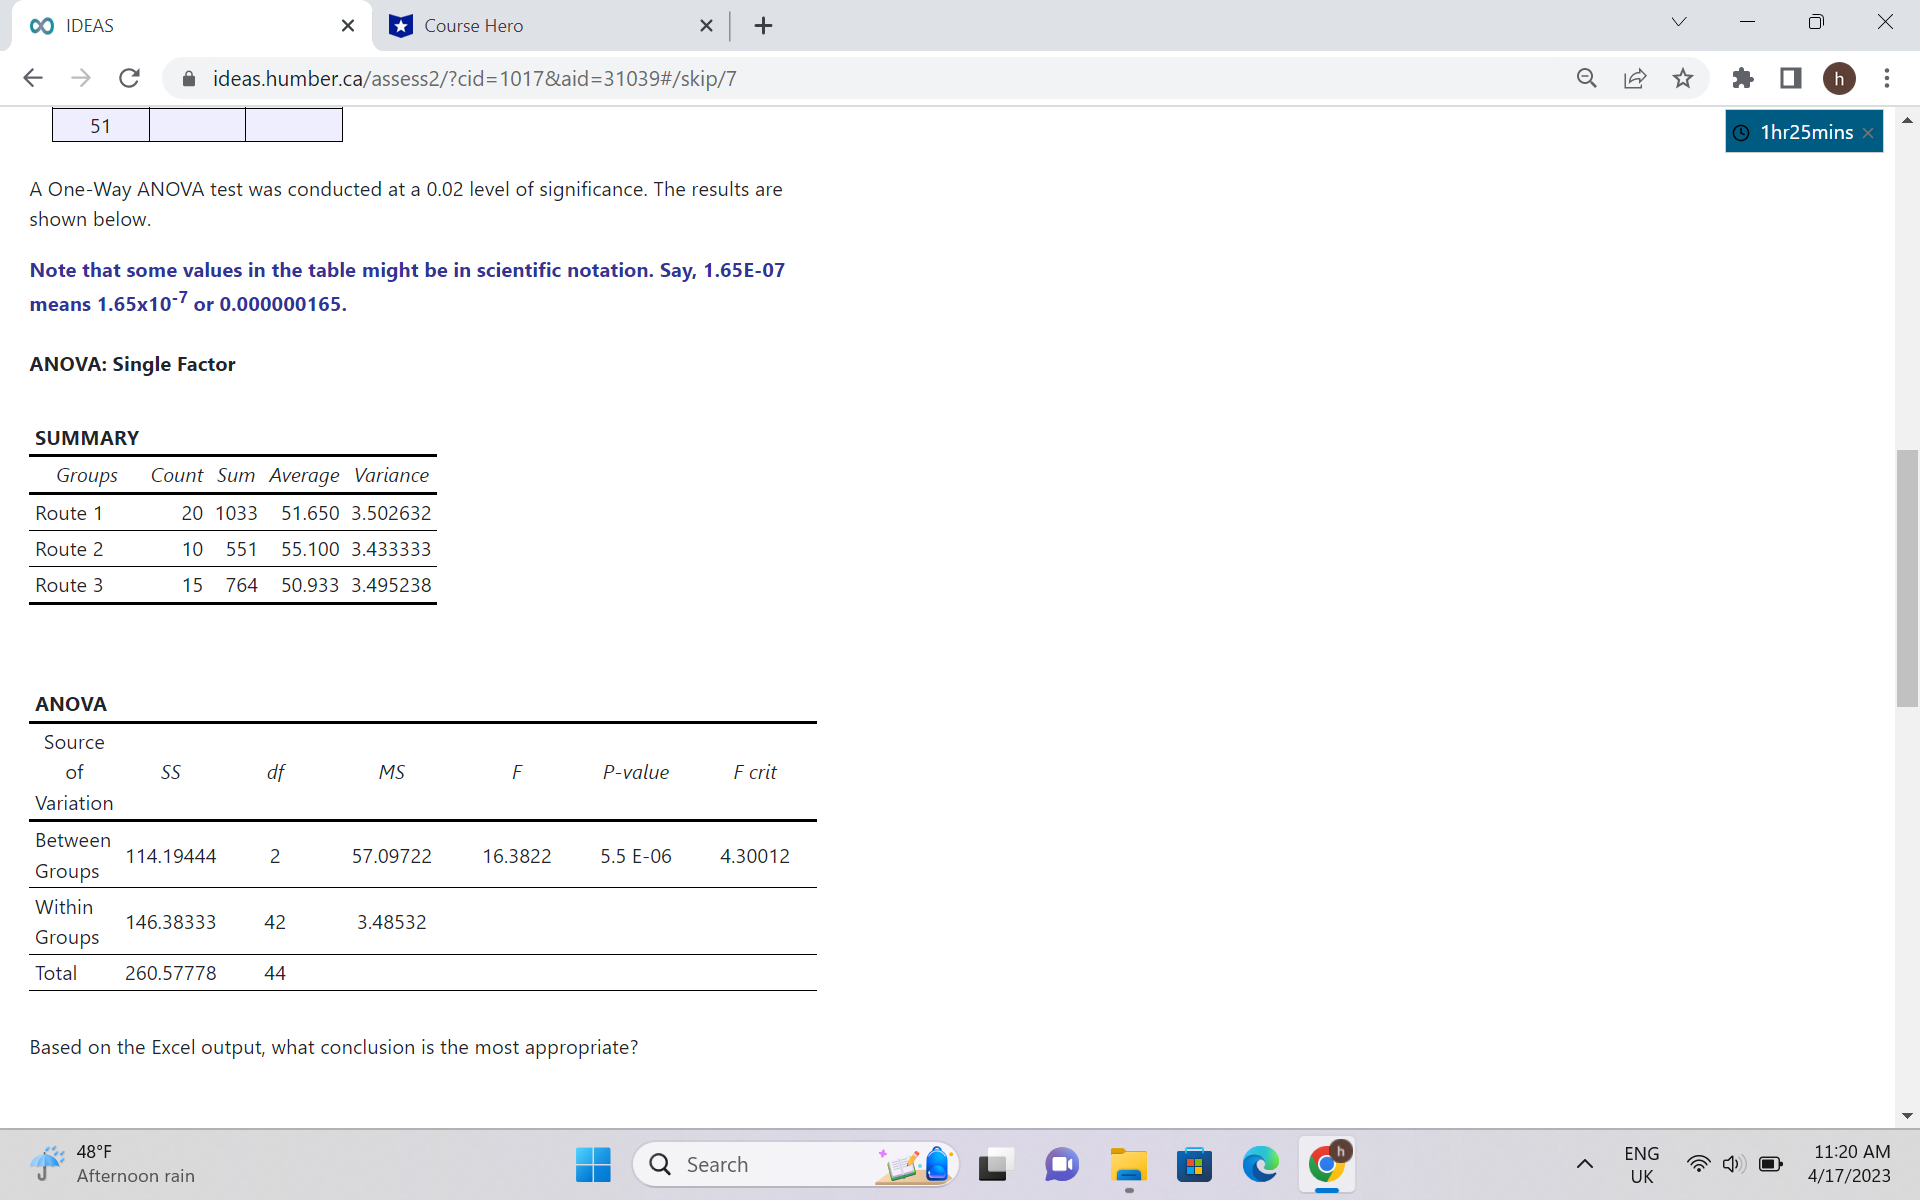
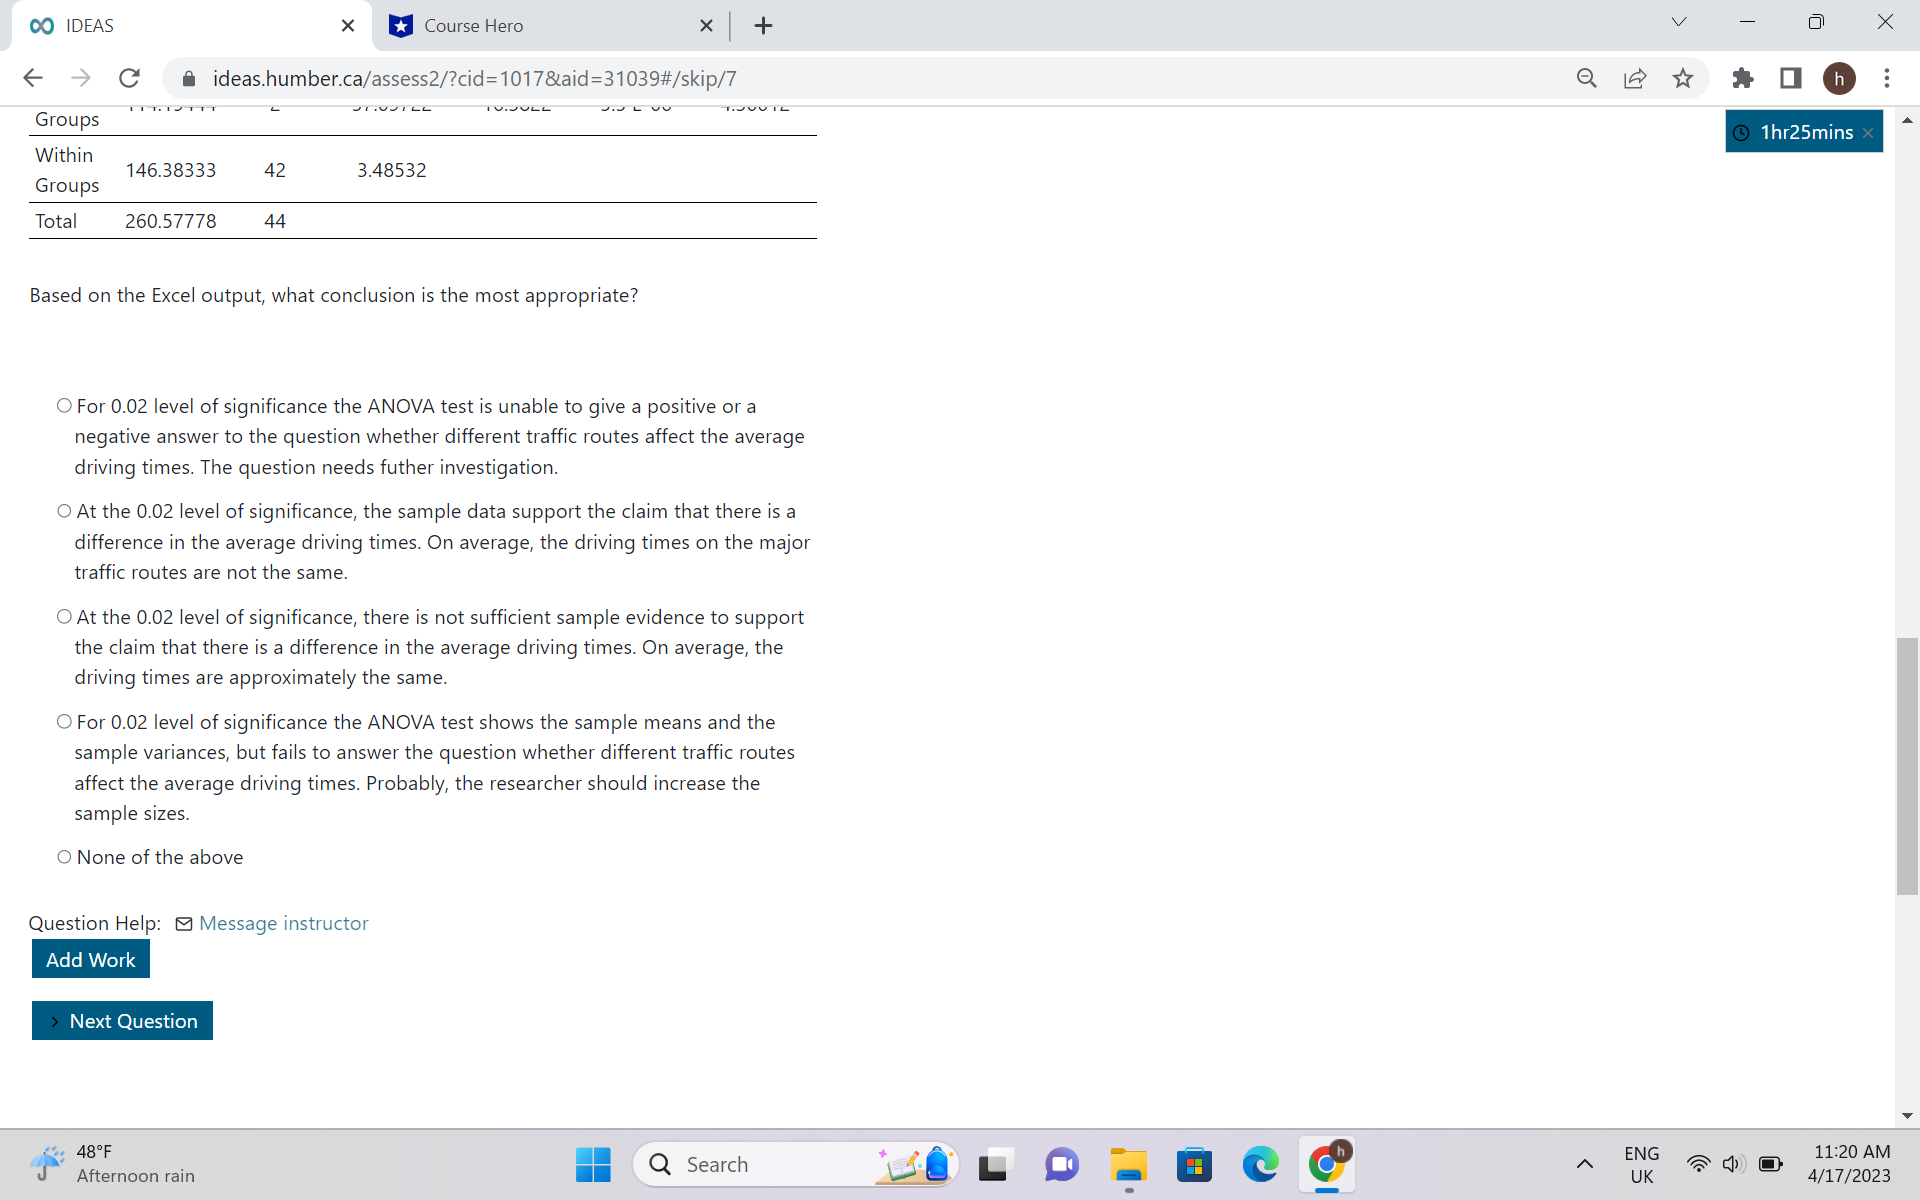
DO IDEAS X Course Hero X + C V ideas.humber.ca/assess2/?cid=1017&aid=31039#/skip/7 X 250 points possible 11/16 answered O h . Question 7 1hr25mins x 6 pts 9 1 0 Details Suppose a researcher is interested determining whether, on average, driving times on the major traffic routes are approximately the same or not. The following data are randomly collected from three major traffic routes. The entries in the table are driving times in minutes on the these routes. Route 1 Route 2 Route 3 52 54 50 53 53 51 51 56 50 51 54 51 51 54 51 53 59 50 56 57 49 50 56 52 50 54 50 53 54 50 50 50 56 50 53 52 50 51 50 57 50 52 51 50 51 48.F Afternoon rain Q Search ENG 11:20 AM UK 4/17/2023DO IDEAS X Course Hero X + V X C ideas.humber.ca/assess2/?cid=1017&aid=31039#/skip/7 O h 51 1hr25mins x A One-Way ANOVA test was conducted at a 0.02 level of significance. The results are shown below. Note that some values in the table might be in scientific notation. Say, 1.65E-07 means 1.65x10" or 0.000000165. ANOVA: Single Factor SUMMARY Groups Count Sum Average Variance Route 1 20 1033 51.650 3.502632 Route 2 10 551 55.100 3.433333 Route 3 15 764 50.933 3.495238 ANOVA Source of SS df MS F P-value F crit Variation Between 114. 19444 2 57.09722 16.3822 5.5 E-06 4.30012 Groups Within 146.38333 42 3.48532 Groups Total 260.57778 44 Based on the Excel output, what conclusion is the most appropriate? 48.F Afternoon rain Q Search ENG 11:20 AM UK 4/17/202300 lDEAS X a Course Hero X I + V C71 X (- C' i ideas.humber.ca/assessZ/?cid:1017&aid:3i039#/skip/7 Q i9 '1? I l] o 5 Within 14638333 42 3.48532 Groups Total 26057778 44 Based on the Excel output, what conclusion is the most appropriate? (3 For 0.02 level of significance the ANOVA test is unable to give a positive or a negative answer to the question whether different traffic routes affect the average driving times. The question needs futher investigation. 0 At the 0.02 level of significance, the sample data support the claim that there is a difference in the average driving times. On average, the driving times on the major traffic routes are not the same. C At the 0.02 level of significance, there is not sufficient sample eVidence to support the claim that there is a difference in the average driving times. On average, the driving times are approximately the same. C For 0.02 level of significance the ANOVA test shows the sample means and the sample variances, but fails to answer the question whether different traffic routes affect the average driving times. Probably, the researcher should increase the sample sizes O None ofthe above Question Help: 8 Message instiuttOi Add Work N ext Qu estion "(1 48F I Afternoon rain I. Q Search 9)) - . ENG 11:20 AM - l e G A UK (1' E} 4/17/2023
Step by Step Solution
There are 3 Steps involved in it

Get step-by-step solutions from verified subject matter experts