

Question: Need help with question 2 & 3 please A B C G 1 Medium Source Campaign 2 Paid Search Google Car Insurance 3 Paid Search
Need help with question 2 & 3 please
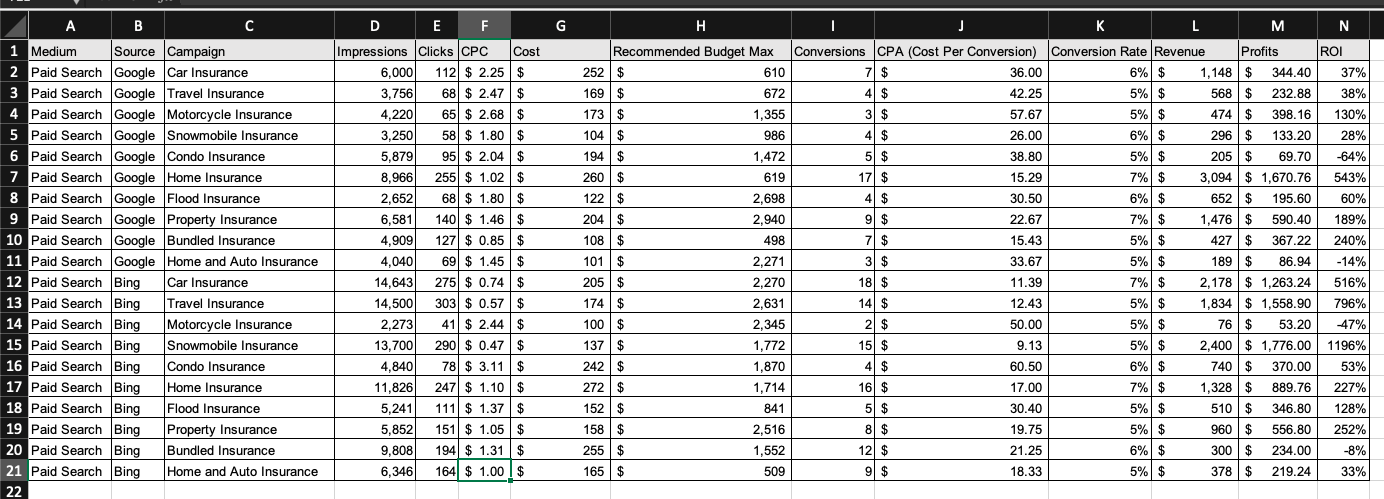
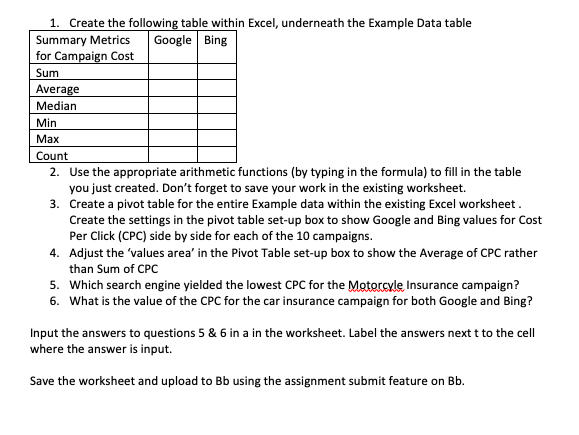
A B C G 1 Medium Source Campaign 2 Paid Search Google Car Insurance 3 Paid Search Google Travel Insurance 4 Paid Search Google Motorcycle Insurance 5 Paid Search Google Snowmobile Insurance 6 Paid Search Google Condo Insurance 7 Paid Search Google Home Insurance 8 Paid Search Google Flood Insurance 9 Paid Search Google Property Insurance 10 Paid Search Google Bundled Insurance 11 Paid Search Google Home and Auto Insurance 12 Paid Search Bing Car Insurance 13 Paid Search Bing Travel Insurance 14 Paid Search Bing Motorcycle Insurance 15 Paid Search Bing Snowmobile Insurance 16 Paid Search Bing Condo Insurance 17 Paid Search Bing Home Insurance 18 Paid Search Bing Flood Insurance 19 Paid Search Bing Property Insurance 20 Paid Search Bing Bundled Insurance 21 Paid Search Bing Home and Auto Insurance 22 D E F Impressions Clicks CPC Cost 6.000 112 $ 2.25 $ 3,756 68 $ 2.47 $ 4,220 65 $ 2.68 $ 3,250 58 $ 1.80 $ 5,879 95 $ 2.04 $ 8,966 255 $ 1.02 $ 2,652 68 $ 1.80 $ 6,581 1401 $ 1.46 $ 4,909 127) $ 0.85$ 4,040 69 $ 1.45$ 14,643 275 $ 0.74 $ 14,500 303 $ 0.57 $ 2,273 41 $ 2.44 $ 13,700 290 $ 0.47 $ 4,840 78 $ 3.11$ 11,826 247 $ 1.10 $ 5,241 111 $ 1.37$ 5,852 151 $ 1.05$ 9,808 194 $ 1.31 $ 6,346 164 $ 1.00 $ H J K L M N Recommended Budget Max Conversions CPA (Cost Per Conversion) Conversion Rate Revenue Profits ROI 252 $ 610 7 $ 36.00 6% $ 1,148$ 344.40 37% 169 $ 672 4 $ 42.25 5% $ 568 $ 232.88 38% 173 $ 1,355 3 $ 57.67 5% $ 474 $ 398.16 130% 104 $ 986 4 $ 26.00 6% $ 296 $ 133.20 28% 194 $ 1,472 5 $ 38.80 5% $ 205 $ 69.70 -64% 260 $ 619 17 $ 15.29 7% $ 3,094 $ 1,670.76 543% 122 $ 2,698 4 $ 30.50 6% $ 652 $ 195.60 60% 204 $ 2,940 9 $ 22.67 7% $ 1,476 $ 590.40 189% 108$ 498 7 $ 15.43 5% $ 427 $ 367.22 240% 101 $ 2,271 31 $ 33.67 5% $ 189 $ 86.94 -14% 205 $ 2,270 181 $ 11.39 7% $ 2,178 $ 1,263.24 516% 174 $ 2,631 14 $ 12.43 5% $ 1,834 $ 1,558.90 796% 100 $ 2.345 2 $ 50.00 5% $ 76 $ 53.20 -47% 137 $ 1,772 15 $ 9.13 5% $ 2,400 $ 1,776.00 1196% 242 $ 1,870 4 $ 60.50 6% $ 740$ 370.00 53% 272 $ 1,714 160 $ 17.00 7% $ 1,328 $ 889.76 227% 152 $ 841 5 $ 30.40 5% $ 510 $ 346.80 128% 158 $ 2,516 8 $ 19.75 5% $ 960 $ 556.80 252% 255$ 1,552 12 $ 21.25 6% $ 300 $ 234.00 -8% 165 $ 509 9 $ 18.33 5% $ 378 $ 33% 219.24 1. Create the following table within Excel, underneath the Example Data table Summary Metrics Google Bing for Campaign Cost Sum Average Median Min Max Count 2. Use the appropriate arithmetic functions (by typing in the formula) to fill in the table you just created. Don't forget to save your work in the existing worksheet. 3. Create a pivot table for the entire Example data within the existing Excel worksheet. Create the settings in the pivot table set-up box to show Google and Bing values for Cost Per Click (CPC) side by side for each of the 10 campaigns. 4. Adjust the 'values area' in the Pivot Table set-up box to show the average of CPC rather than Sum of CPC 5. Which search engine yielded the lowest CPC for the Motorcyle Insurance campaign? 6. What is the value of the CPC for the car insurance campaign for both Google and Bing? Input the answers to questions 5 & 6 in a in the worksheet. Label the answers next t to the cell where the answer is input. Save the worksheet and upload to Bb using the assignment submit feature on BbStep by Step Solution
There are 3 Steps involved in it
1 Expert Approved Answer
Step: 1 Unlock

Question Has Been Solved by an Expert!
Get step-by-step solutions from verified subject matter experts
Step: 2 Unlock
Step: 3 Unlock