

Question: need help with question (CO 6) A scatter plot generally shows the dots going from low y values and low x values, to high y
need help with question
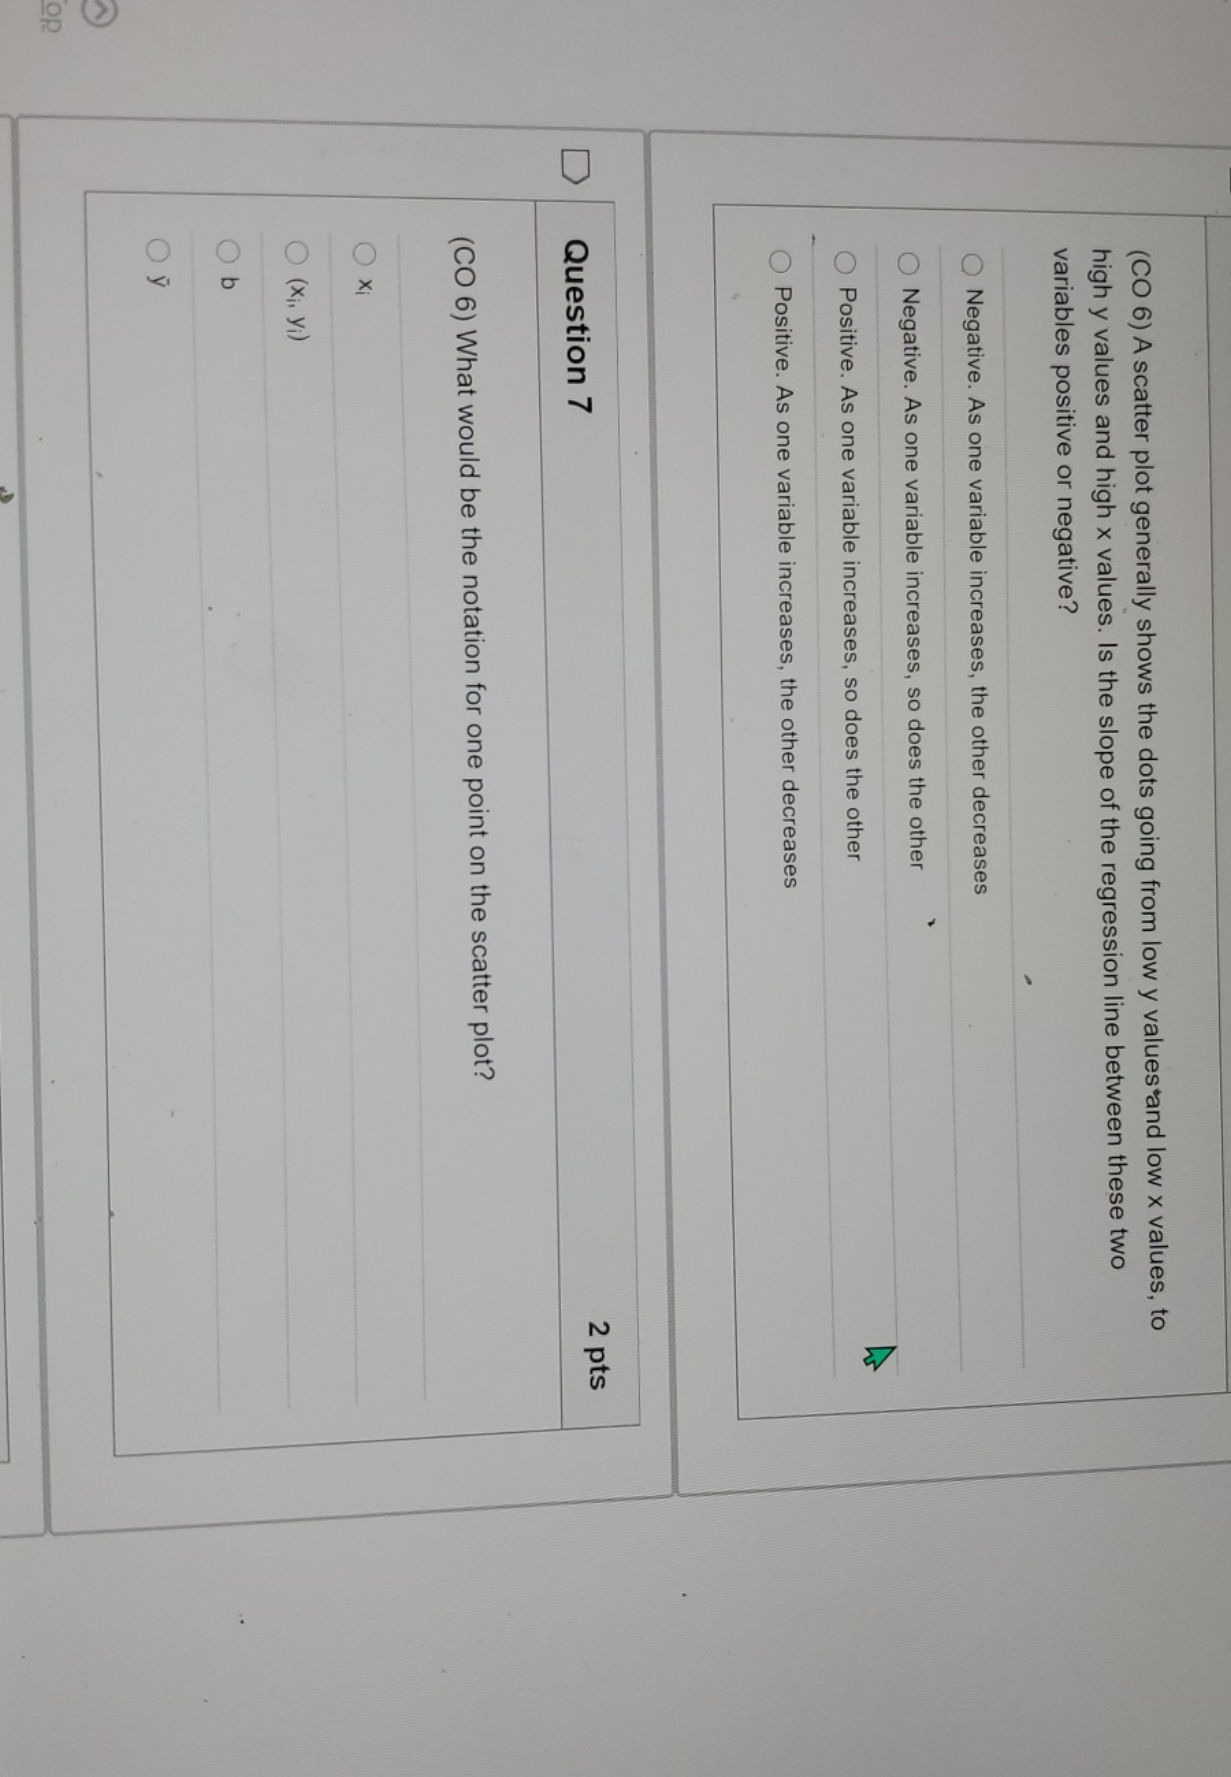
(CO 6) A scatter plot generally shows the dots going from low y values and low x values, to high y values and high x values. Is the slope of the regression line between these two variables positive or negative? Negative. As one variable increases, the other decreases Negative. As one variable increases, so does the other Positive. As one variable increases, so does the other Positive. As one variable increases, the other decreases Question 7 2 pts (CO 6) What would be the notation for one point on the scatter plot? O Xi ( Xi, yi) Ob Oy
Step by Step Solution
There are 3 Steps involved in it
1 Expert Approved Answer
Step: 1 Unlock

Question Has Been Solved by an Expert!
Get step-by-step solutions from verified subject matter experts
Step: 2 Unlock
Step: 3 Unlock