Question: Need help with solving 3-3 , 3-6 , and 3-7 : 62 PART 2: FINANCIAL PLANNING AND CONTROL $1,000 3-4 Net sales Less: Cost of
Need help with solving 3-3, 3-6, and 3-7:
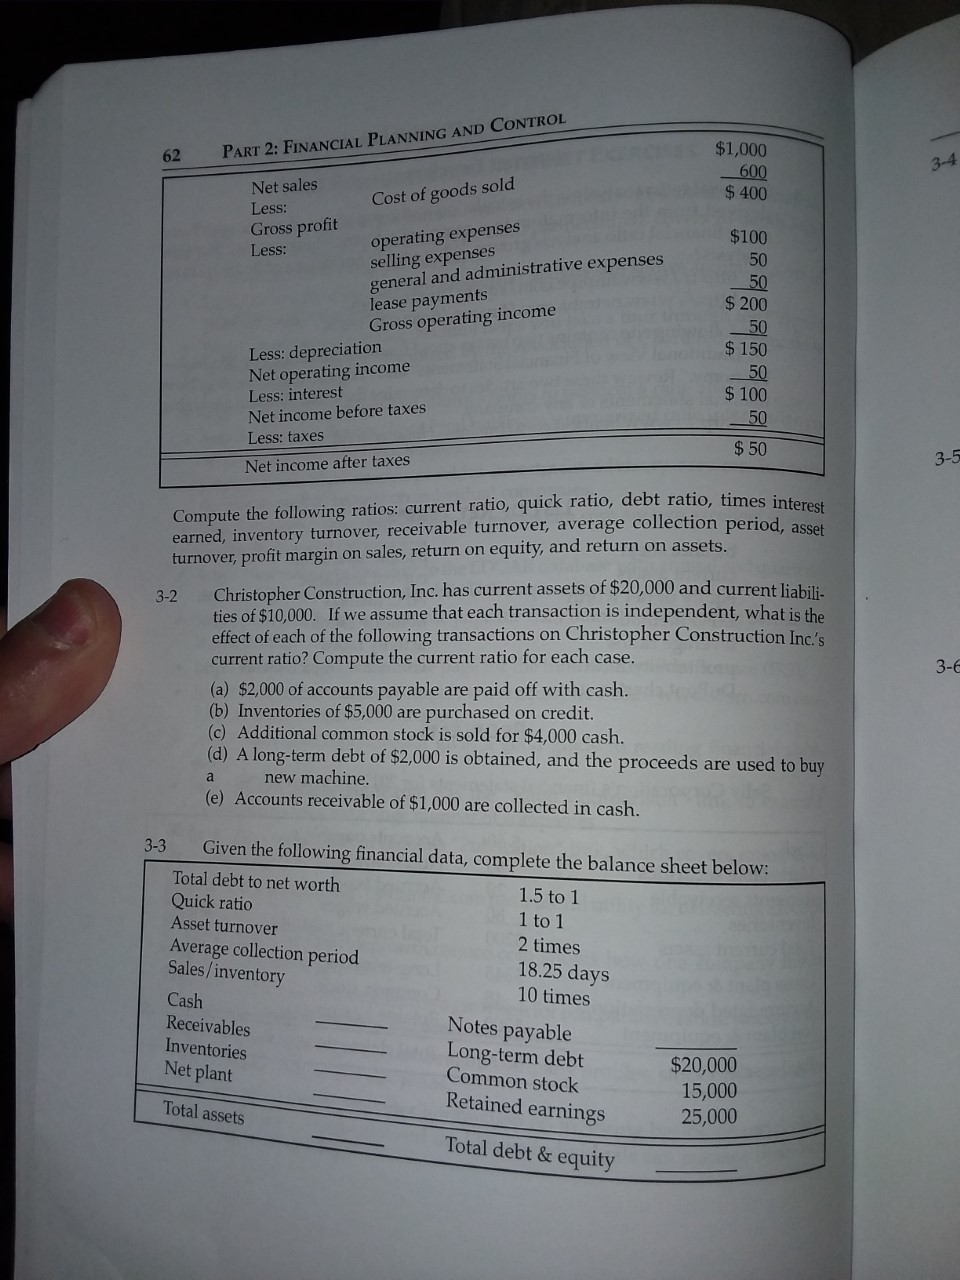
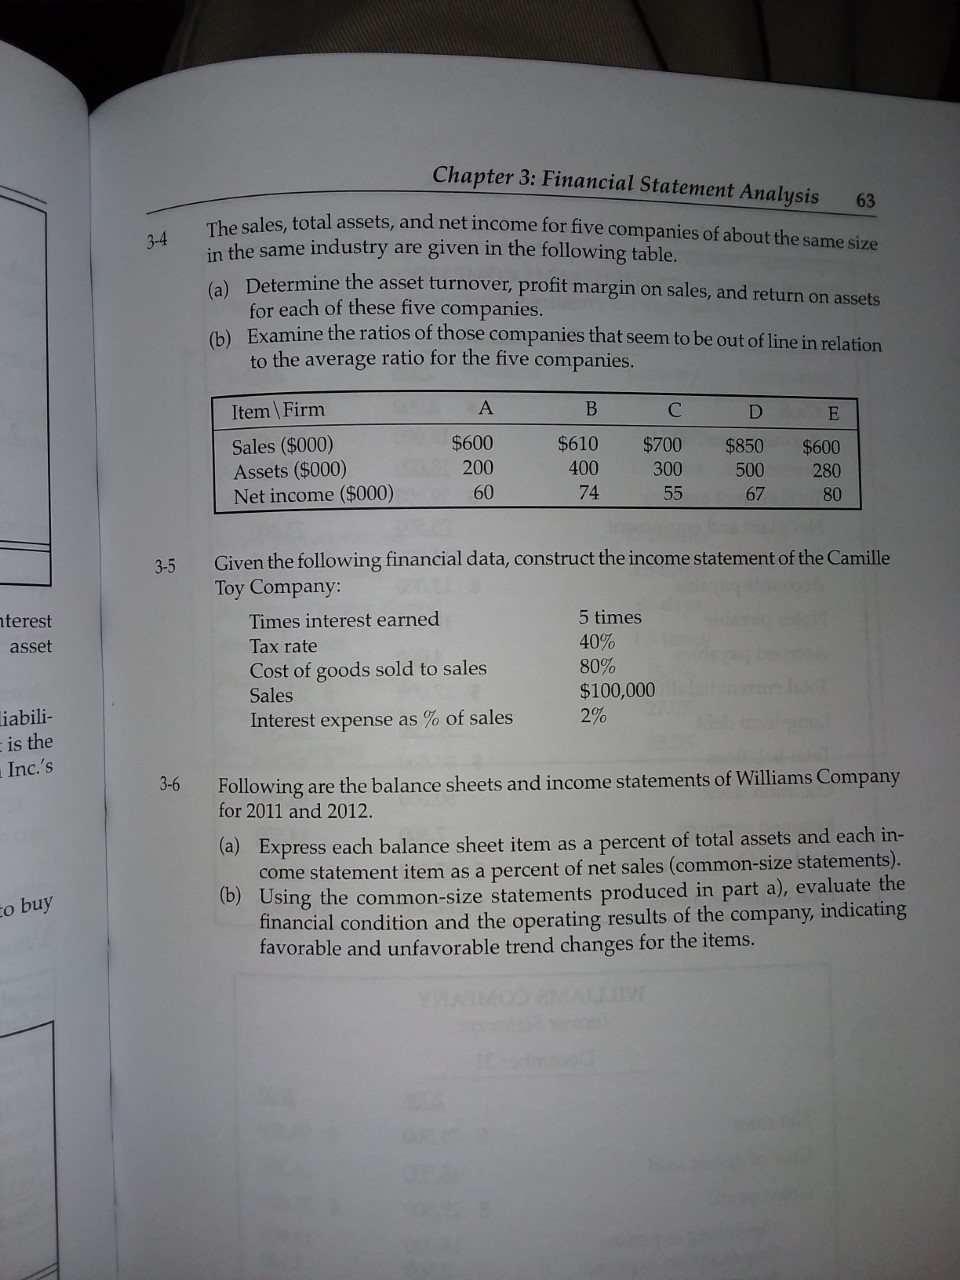
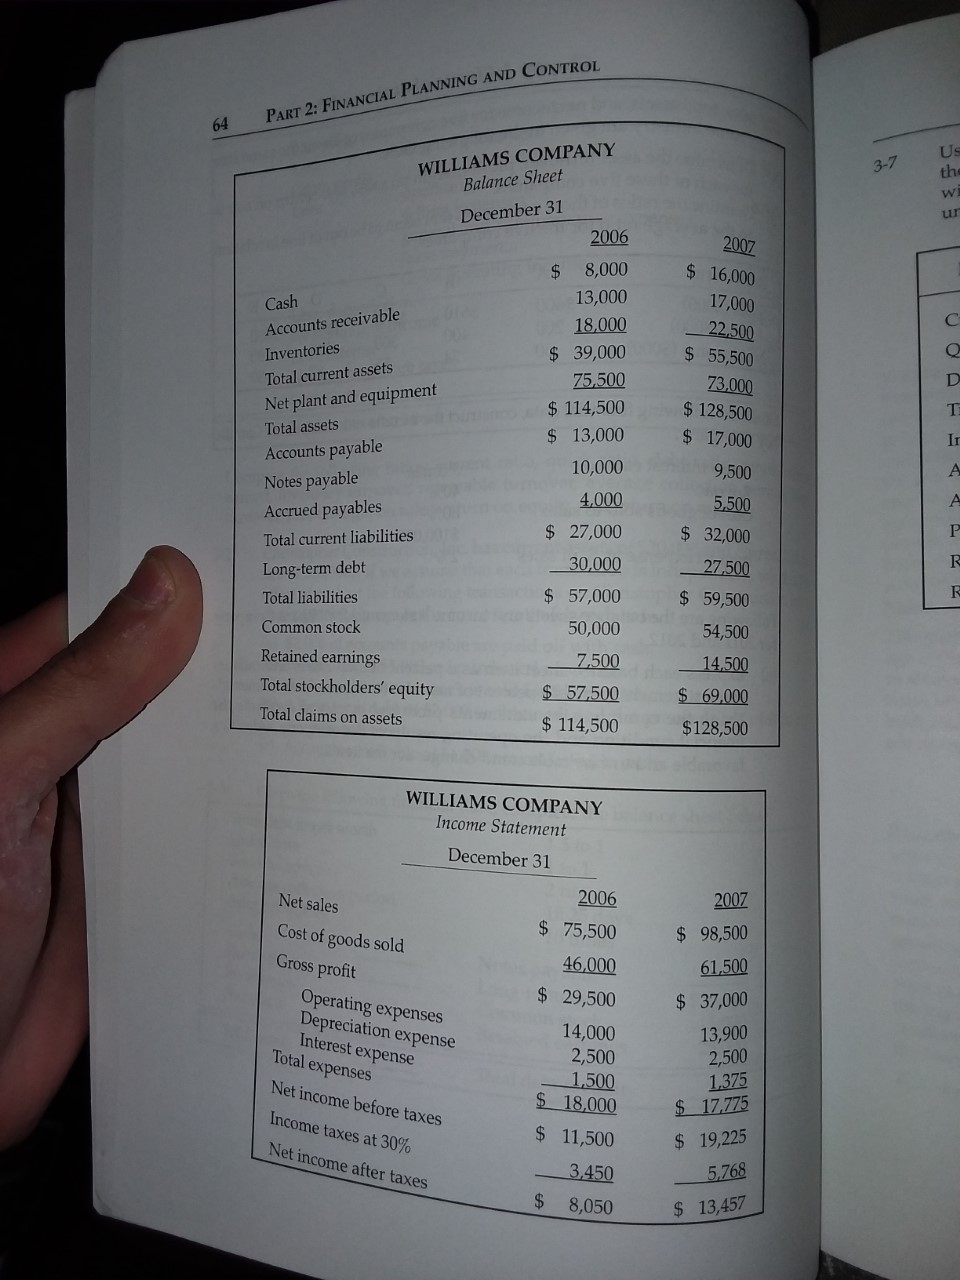
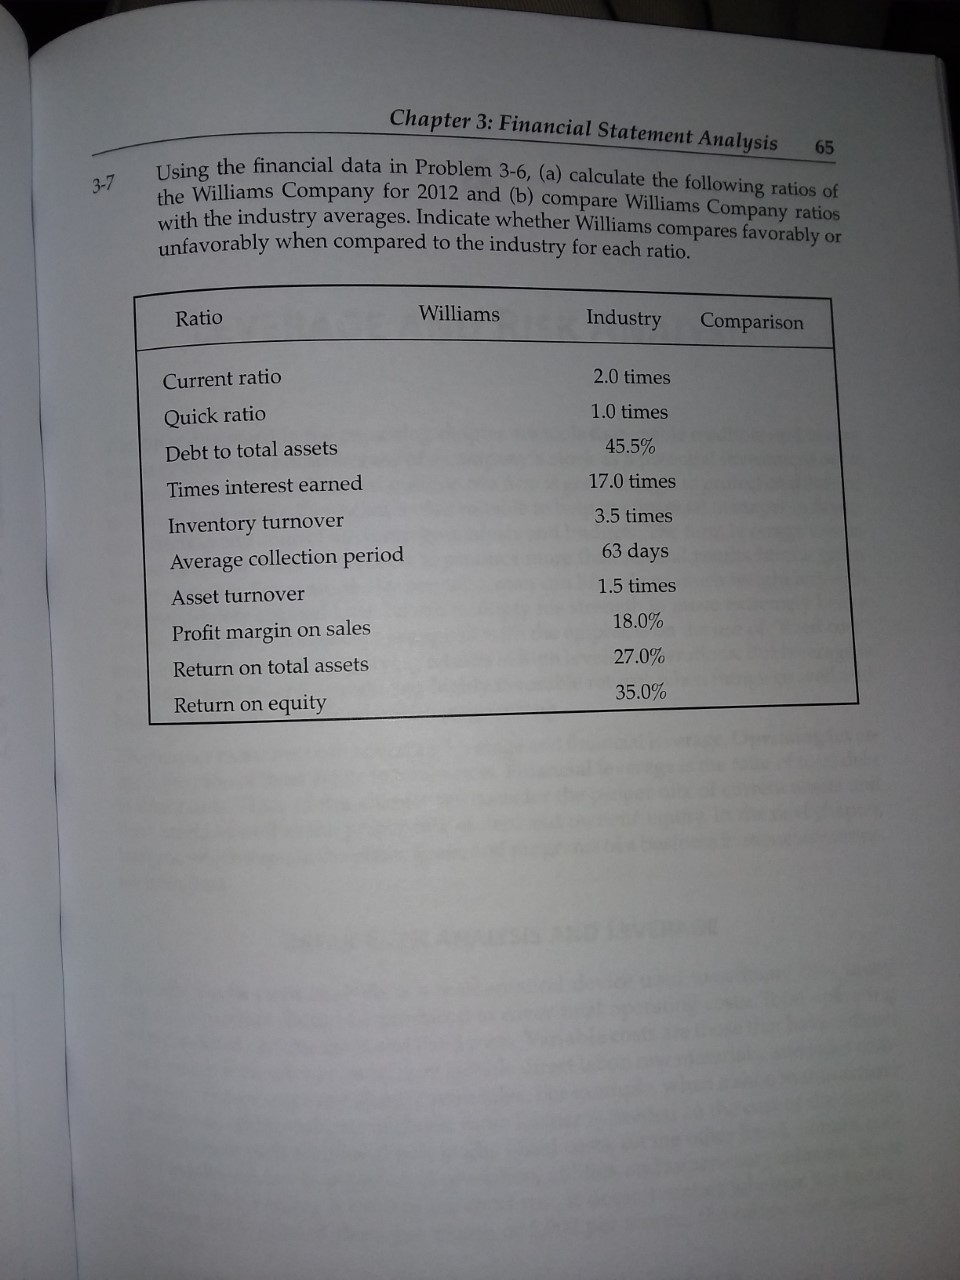
62 PART 2: FINANCIAL PLANNING AND CONTROL $1,000 3-4 Net sales Less: Cost of goods sold $ 400 Gross profit Less: operating expenses $100 selling expenses general and administrative expenses 50 lease payments 50 Gross operating income $ 200 50 Less: depreciation $ 150 Net operating income 50 Less: interest Net income before taxes $ 100 Less: taxes 50 Net income after taxes $ 50 3 -5 Compute the following ratios: current ratio, quick ratio, debt ratio, times interest earned, inventory turnover, receivable turnover, average collection period, asset turnover, profit margin on sales, return on equity, and return on assets. 3-2 Christopher Construction, Inc. has current assets of $20,000 and current liabili ties of $10,000. If we assume that each transaction is independent, what is the effect of each of the following transactions on Christopher Construction Inc.'s current ratio? Compute the current ratio for each case. (a) $2,000 of accounts payable are paid off with cash. 3 -6 (b) Inventories of $5,000 are purchased on credit. (c) Additional common stock is sold for $4,000 cash. a (d) A long-term debt of $2,000 is obtained, and the proceeds are used to buy new machine. (e) Accounts receivable of $1,000 are collected in cash. 3-3 Given the following financial data, complete the balance sheet below: Total debt to net worth Quick ratio 1.5 to 1 Asset turnover 1 to 1 Average collection period 2 times Sales/ inventory 18.25 days Cash 10 times Receivables Inventories Notes payable Net plant Long-term debt Common stock $20,000 Total assets Retained earnings 15,000 25,000 Total debt & equityChapter 3: Financial Statement Analysis 63 3-4 The sales, total assets, and net income for five companies of about the same size in the same industry are given in the following table. (a) Determine the asset turnover, profit margin on sales, and return on assets for each of these five companies. (b) Examine the ratios of those companies that seem to be out of line in relation to the average ratio for the five companies. Item\\Firm A B C D E Sales ($000) $600 $610 $700 $850 Assets ($000) 200 $600 400 300 500 Net income ($000) 280 60 74 55 67 80 3-5 Given the following financial data, construct the income statement of the Camille Toy Company: terest Times interest earned 5 times asset Tax rate 40% Cost of goods sold to sales 80% Sales $100,000 iabili- 2% is the Interest expense as % of sales Inc.'s 3-6 Following are the balance sheets and income statements of Williams Company for 2011 and 2012. (a) Express each balance sheet item as a percent of total assets and each in- come statement item as a percent of net sales (common-size statements). to buy (b) Using the common-size statements produced in part a), evaluate the financial condition and the operating results of the company, indicating favorable and unfavorable trend changes for the items. AMOD eMALLTYPART 2: FINANCIAL PLANNING AND CONTROL 64 WILLIAMS COMPANY 3-7 U Balance Sheet th wi December 31 2006 2007 $ 8,000 $ 16,000 Cash 13,000 17,000 Accounts receivable 18,000 22,500 Inventories $ 39,000 $ 55,500 Total current assets 75,500 Net plant and equipment 73,000 $ 114,500 $ 128,500 Total assets Accounts payable $ 13,000 $ 17,000 Notes payable 10,000 9,500 Accrued payables 4,000 5,500 Total current liabilities $ 27,000 $ 32,000 Long-term debt 30,000 27,500 Total liabilities $ 57,000 $ 59,500 Common stock 50,000 54,500 Retained earnings 7,500 14,500 Total stockholders' equity $ 57.500 $ 69,000 Total claims on assets $ 114,500 $128,500 WILLIAMS COMPANY Income Statement December 31 Net sales 2006 2007 Cost of goods sold $ 75,500 $ 98,500 Gross profit 46,000 61,500 Operating expenses $ 29,500 $ 37,000 Depreciation expense 14,000 Interest expense 13,900 Total expenses 2,500 2,500 1,500 1,375 Net income before taxes 18,000 $ 17,775 Income taxes at 30% $ 11,500 $ 19,225 Net income after taxes 3,450 5,768 $ 8,050 $ 13,457Chapter 3: Financial Statement Analysis 65 3-7 Using the financial data in Problem 3-6, (a) calculate the following ratios of the Williams Company for 2012 and (b) compare Williams Company ratios with the industry averages. Indicate whether Williams compares favorably or unfavorably when compared to the industry for each ratio. Ratio Williams Industry Comparison Current ratio 2.0 times Quick ratio 1.0 times Debt to total assets 45.5% Times interest earned 17.0 times Inventory turnover 3.5 times Average collection period 63 days Asset turnover 1.5 times Profit margin on sales 18.0% Return on total assets 27.0% Return on equity 35.0%