

Question: Need help with some simple linear regression problem that compares height ans shoe size height shoe_size 188 44 172 42.5 171 39 167 38 165
Need help with some simple linear regression problem that compares height ans shoe size
height shoe_size
188 44
172 42.5
171 39
167 38
165 38
165 37
160 37
167 36
178 43
171 42
165 37
173 39
157 35
160 38
177 42
168 38
175 42
170 39
166 39
153 37
174 42
181 43
160 36
182 44
161 36
165 37
181 44
160 35
160 36
163 36
173 42
161 38
177 42
161 37.5
160 36
181 46
154 36
173 39
163 36
168 37
167 40
159 37
165 40
163 37
175 40
160 36
165 38
158 36
165 36
170 42
169 38.5
169 38
182 42
160 37
189 44
160 38
179 44.5
177 40
177 43
165 36
172 37
172 42.5
164 37
188 45
165 38
170 42
175 42
173 42.5
185 44
174 42
158 36
164.5 38
158 36
163 37.5
163 36
175 41
162 37
177 42
175 39
171 39
173 42
163 36
164 38
168 38
168 36
168 37
178 41
158 36
168 37
170 40
168 43
187 44
170 44
165 39
175 42
168 38
168 39
160 37
156 36.5
170 38
186 44
162 37
158 36
180 44
165 36
178 42
165 37
170 45
183 44.5
170 39
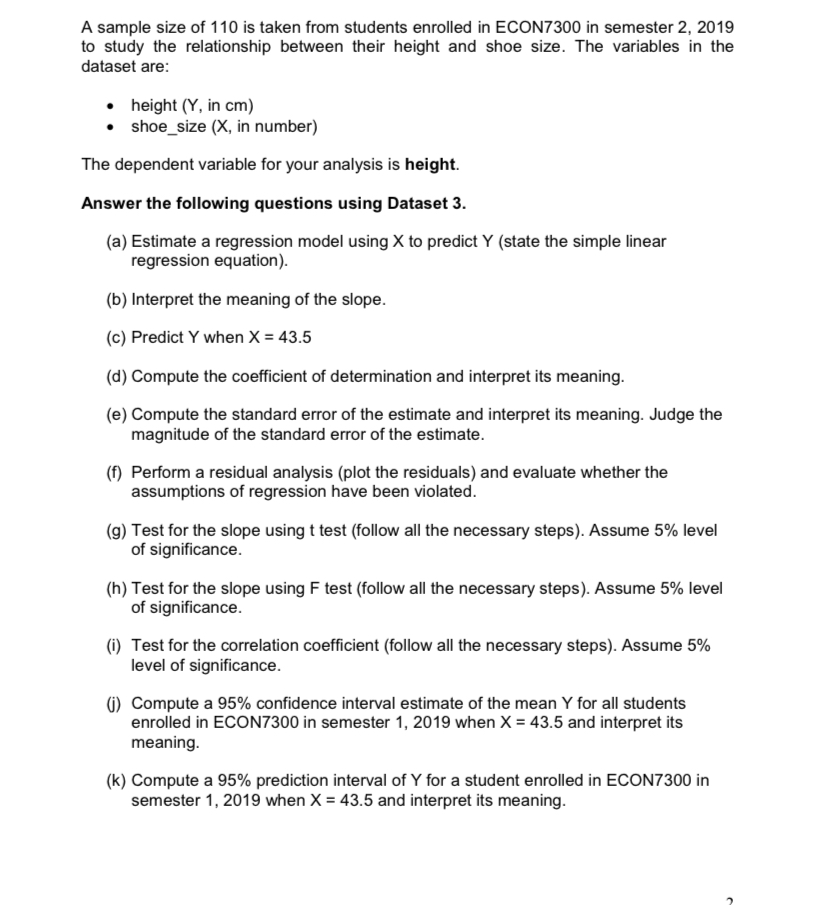
A sample size of 110 is taken from students enrolled in ECON7300 in semester 2, 2019 to study the relationship between their height and shoe size. The variables in the dataset are: height (Y, in cm) . shoe_size (X, in number) The dependent variable for your analysis is height. Answer the following questions using Dataset 3. (a) Estimate a regression model using X to predict Y (state the simple linear regression equation). (b) Interpret the meaning of the slope. (c) Predict Y when X = 43.5 (d) Compute the coefficient of determination and interpret its meaning. (e) Compute the standard error of the estimate and interpret its meaning. Judge the magnitude of the standard error of the estimate. (f) Perform a residual analysis (plot the residuals) and evaluate whether the assumptions of regression have been violated. (g) Test for the slope using t test (follow all the necessary steps). Assume 5% level of significance. (h) Test for the slope using F test (follow all the necessary steps). Assume 5% level of significance. (i) Test for the correlation coefficient (follow all the necessary steps). Assume 5% level of significance. (j) Compute a 95% confidence interval estimate of the mean Y for all students enrolled in ECON7300 in semester 1, 2019 when X = 43.5 and interpret its meaning. (k) Compute a 95% prediction interval of Y for a student enrolled in ECON7300 in semester 1, 2019 when X = 43.5 and interpret its meaning
Step by Step Solution
There are 3 Steps involved in it

Get step-by-step solutions from verified subject matter experts