

Question: Need help with SPSS Having trouble with a question. How do I separate the other brands label to make a frequency table and histograph, using
Need help with SPSS 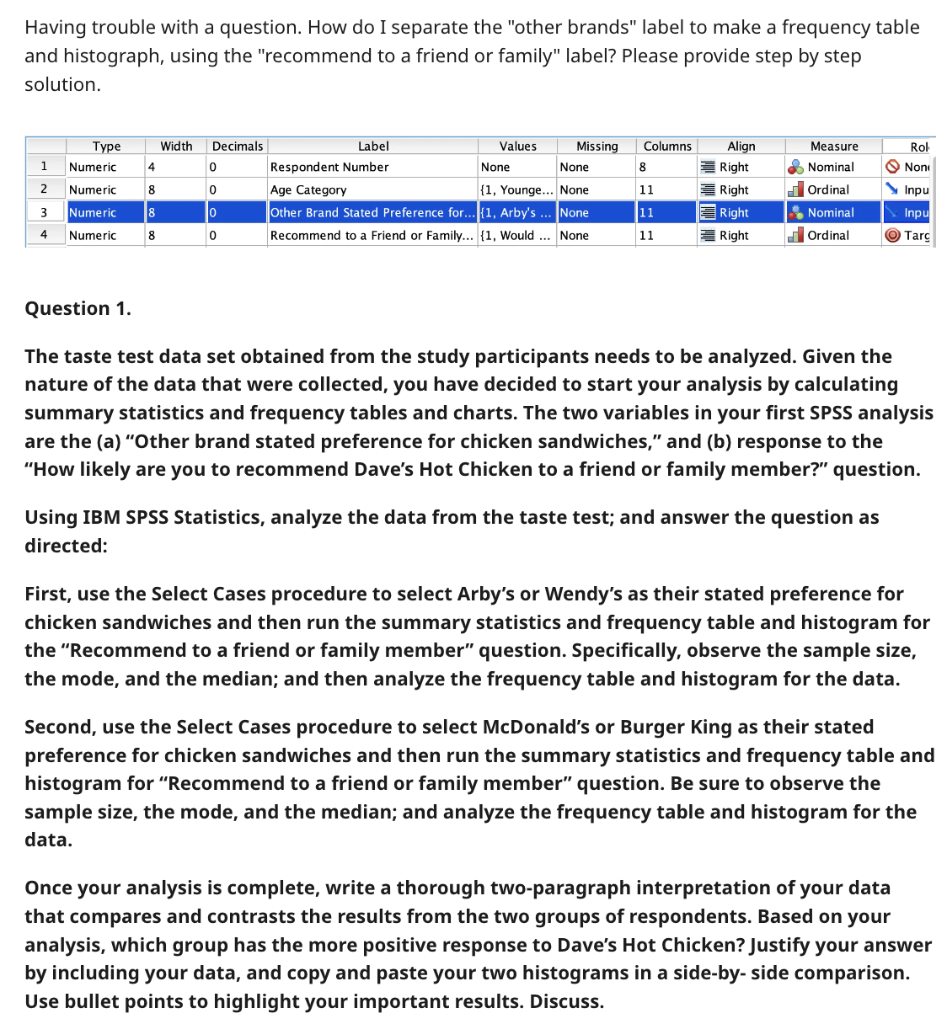
Having trouble with a question. How do I separate the "other brands" label to make a frequency table and histograph, using the "recommend to a friend or family" label? Please provide step by step solution. Question 1. The taste test data set obtained from the study participants needs to be analyzed. Given the nature of the data that were collected, you have decided to start your analysis by calculating summary statistics and frequency tables and charts. The two variables in your first SPSS analysis are the (a) "Other brand stated preference for chicken sandwiches," and (b) response to the "How likely are you to recommend Dave's Hot Chicken to a friend or family member?" question. Using IBM SPSS Statistics, analyze the data from the taste test; and answer the question as directed: First, use the Select Cases procedure to select Arby's or Wendy's as their stated preference for chicken sandwiches and then run the summary statistics and frequency table and histogram for the "Recommend to a friend or family member" question. Specifically, observe the sample size, the mode, and the median; and then analyze the frequency table and histogram for the data. Second, use the Select Cases procedure to select McDonald's or Burger King as their stated preference for chicken sandwiches and then run the summary statistics and frequency table and histogram for "Recommend to a friend or family member" question. Be sure to observe the sample size, the mode, and the median; and analyze the frequency table and histogram for the data. Once your analysis is complete, write a thorough two-paragraph interpretation of your data that compares and contrasts the results from the two groups of respondents. Based on your analysis, which group has the more positive response to Dave's Hot Chicken? Justify your answer by including your data, and copy and paste your two histograms in a side-by- side comparison. Use bullet points to highlight your important results. Discuss
Step by Step Solution
There are 3 Steps involved in it

Get step-by-step solutions from verified subject matter experts