

Question: Need help with Statistics 3. [13 marks] A random sample of twenty-ve STAT 231 students was taken in order to investigate whether or not there
Need help with Statistics
![Need help with Statistics 3. [13 marks] A random sample of twenty-ve](https://dsd5zvtm8ll6.cloudfront.net/si.experts.images/questions/2024/10/6708dc098cf1f_8656708dc096b4ae.jpg)
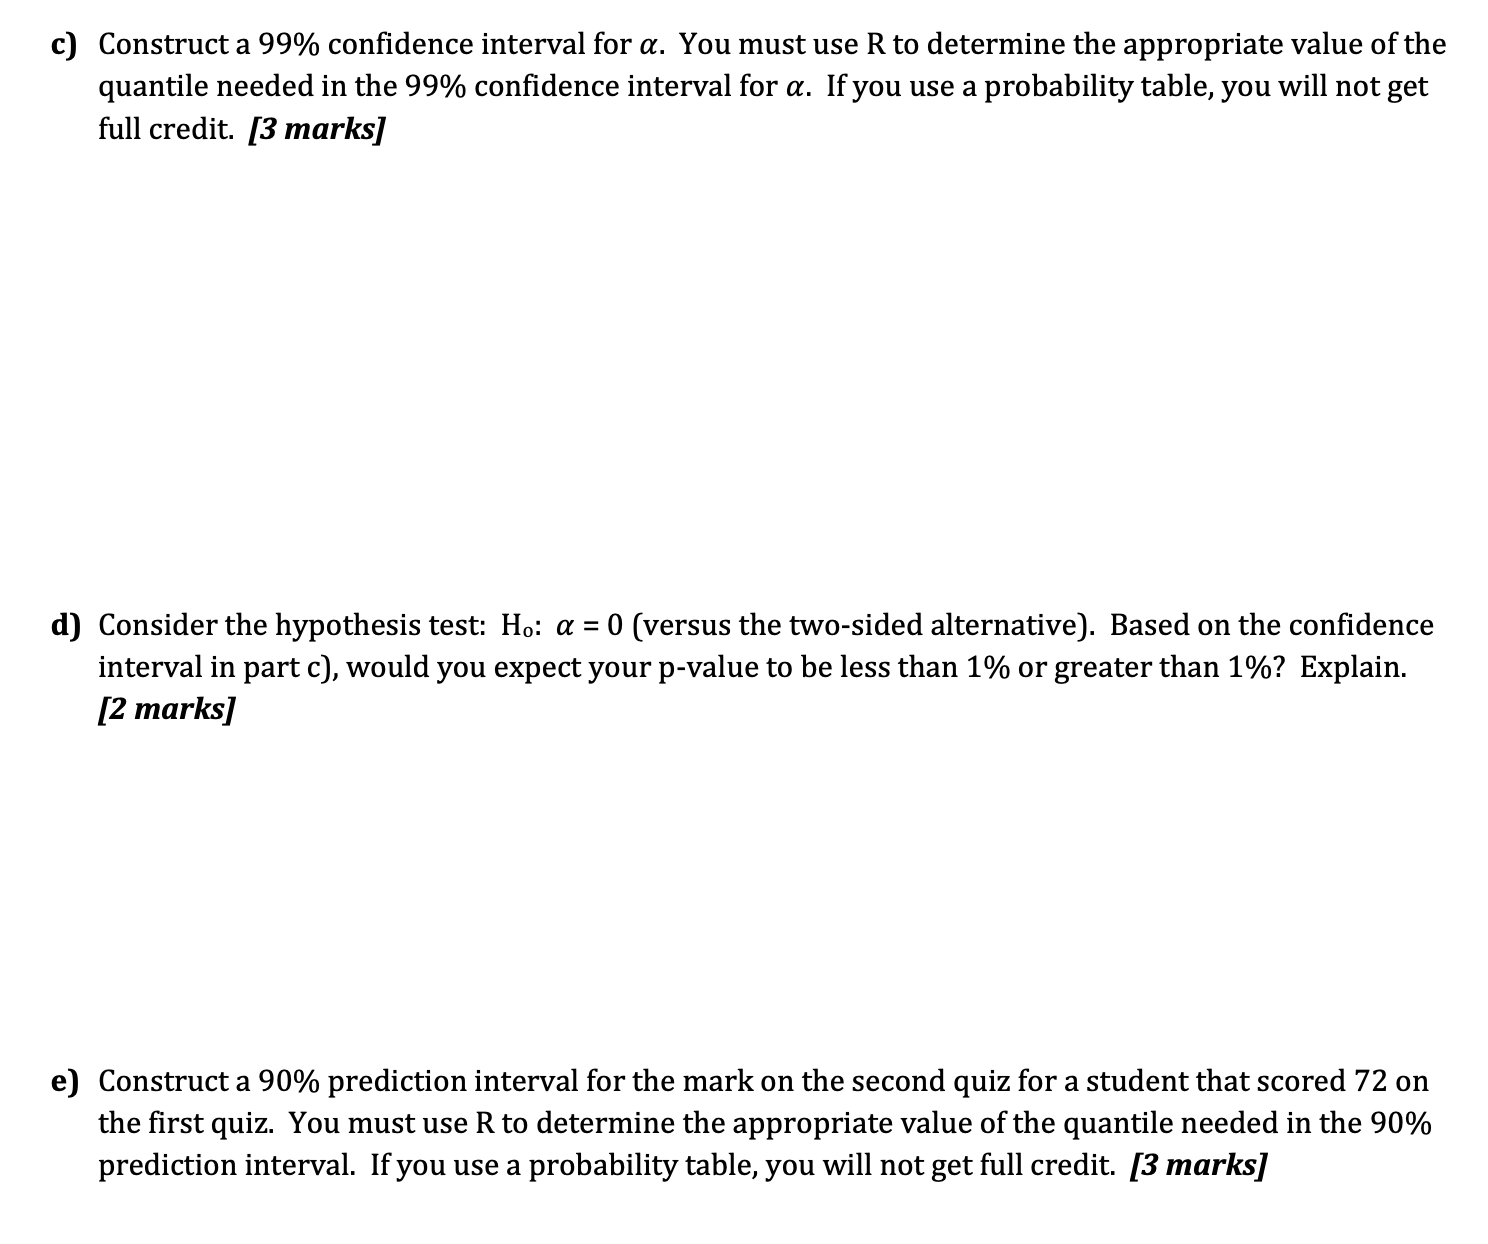
3. [13 marks] A random sample of twenty-ve STAT 231 students was taken in order to investigate whether or not there is a relationship between the second quiz mark [Y] and the rst quiz mark (x). The relationship is modeled using the following: 1': = a + Bx,- + Ri, where R, ~ G[0, 6), i = 1, 2, ...., 25; independent Some estimates based on the data are given below: & = 3.94, 3 = 1.05, 53 = 164.192, i221 x,- = 1,854, 5,? = 50.75138 a) Test the hypothesis that there is no relationship between the first quiz mark and the second quiz mark. State the null and alternative hypotheses. Calculate the observed value of the test statistic that would be used to test Ho [versus the two-sided alternative). Be sure to state the distribution of the test statistic, assuming H0 is true. Include the degrees of freedom of the test statistic, if needed. You do NOT need to calculate the p-value in this part of the question. That will be done in part b). [3 marks] b) Using R and the result from part a), calculate the appropriate p-value in order to test Ho: [3 = 0 (versus the two-sided alternative]. You must include the R code used for the calculation for full credit. [2 marks] c) Construct a 99% confidence interval for a. You must use R to determine the appropriate value of the quantile needed in the 99% condence interval for a. If you use a probability table, you will not get full credit. [3 marks] (I) Consider the hypothesis test: H0: at = 0 [versus the two-sided alternative]. Based on the confidence interval in part c), would you expect your p-value to be less than 1% or greater than 1%? Explain. [2 marks] e) Construct a 90% prediction interval for the mark on the second quiz for a student that scored 72 on the rst quiz. You must use R to determine the appropriate value of the quantile needed in the 90% prediction interval. If you use a probability table, you will not get full credit. [3 marks]
Step by Step Solution
There are 3 Steps involved in it

Get step-by-step solutions from verified subject matter experts