

Question: Need help with statistics. The following table shows samples of the food bills for patrons at two restaurants (measured in dollars, before taxes) You could
Need help with statistics.
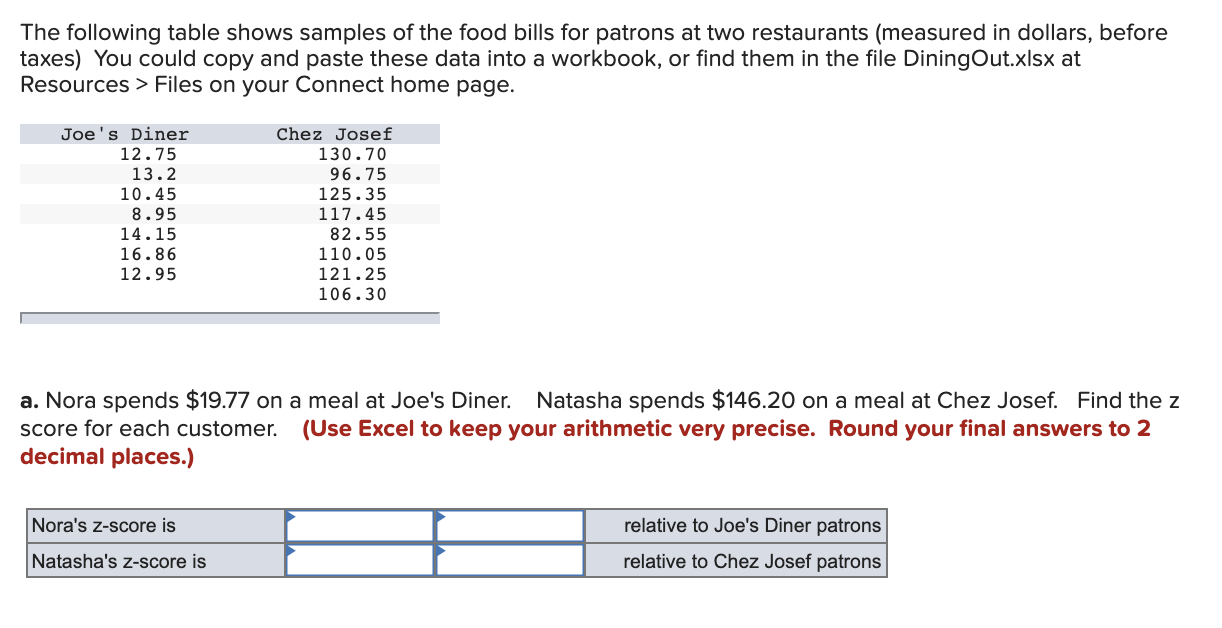
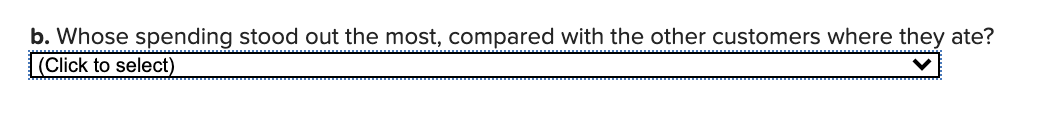
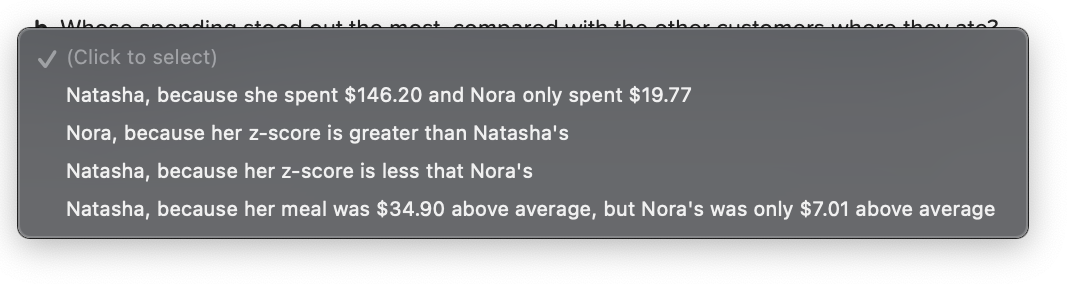
The following table shows samples of the food bills for patrons at two restaurants (measured in dollars, before taxes) You could copy and paste these data into a workbook, or find them in the file DiningOut.xIsx at Resources > Files on your Connect home page. Joe's Diner Chez Josef 12. 75 130.70 13.2 96.75 10 .45 125.35 8.95 117.45 14 . 15 82. 55 16 . 86 110 .05 12.95 121 .25 106.30 a. Nora spends $19.77 on a meal at Joe's Diner. Natasha spends $146.20 on a meal at Chez Josef. Find the z score for each customer. (Use Excel to keep your arithmetic very precise. Round your final answers to 2 decimal places.) Nora's z-score is relative to Joe's Diner patrons Natasha's z-score is relative to Chez Josef patronsb. Whose spending stood out the most, compared with the other customers where they ate? Click to select v with the V (Click to select) Natasha, because she spent $146.20 and Nora only spent $19.77 Nora, because her z-score is greater than Natasha's Natasha, because her z-score is less that Nora's Natasha, because her meal was $34.90 above average, but Nora's was only $7.01 above average
Step by Step Solution
There are 3 Steps involved in it

Get step-by-step solutions from verified subject matter experts