

Question: Need help with stats Having done poorly on a particular exam in a junior high school, 22 students decide to write the exam again to
Need help with stats
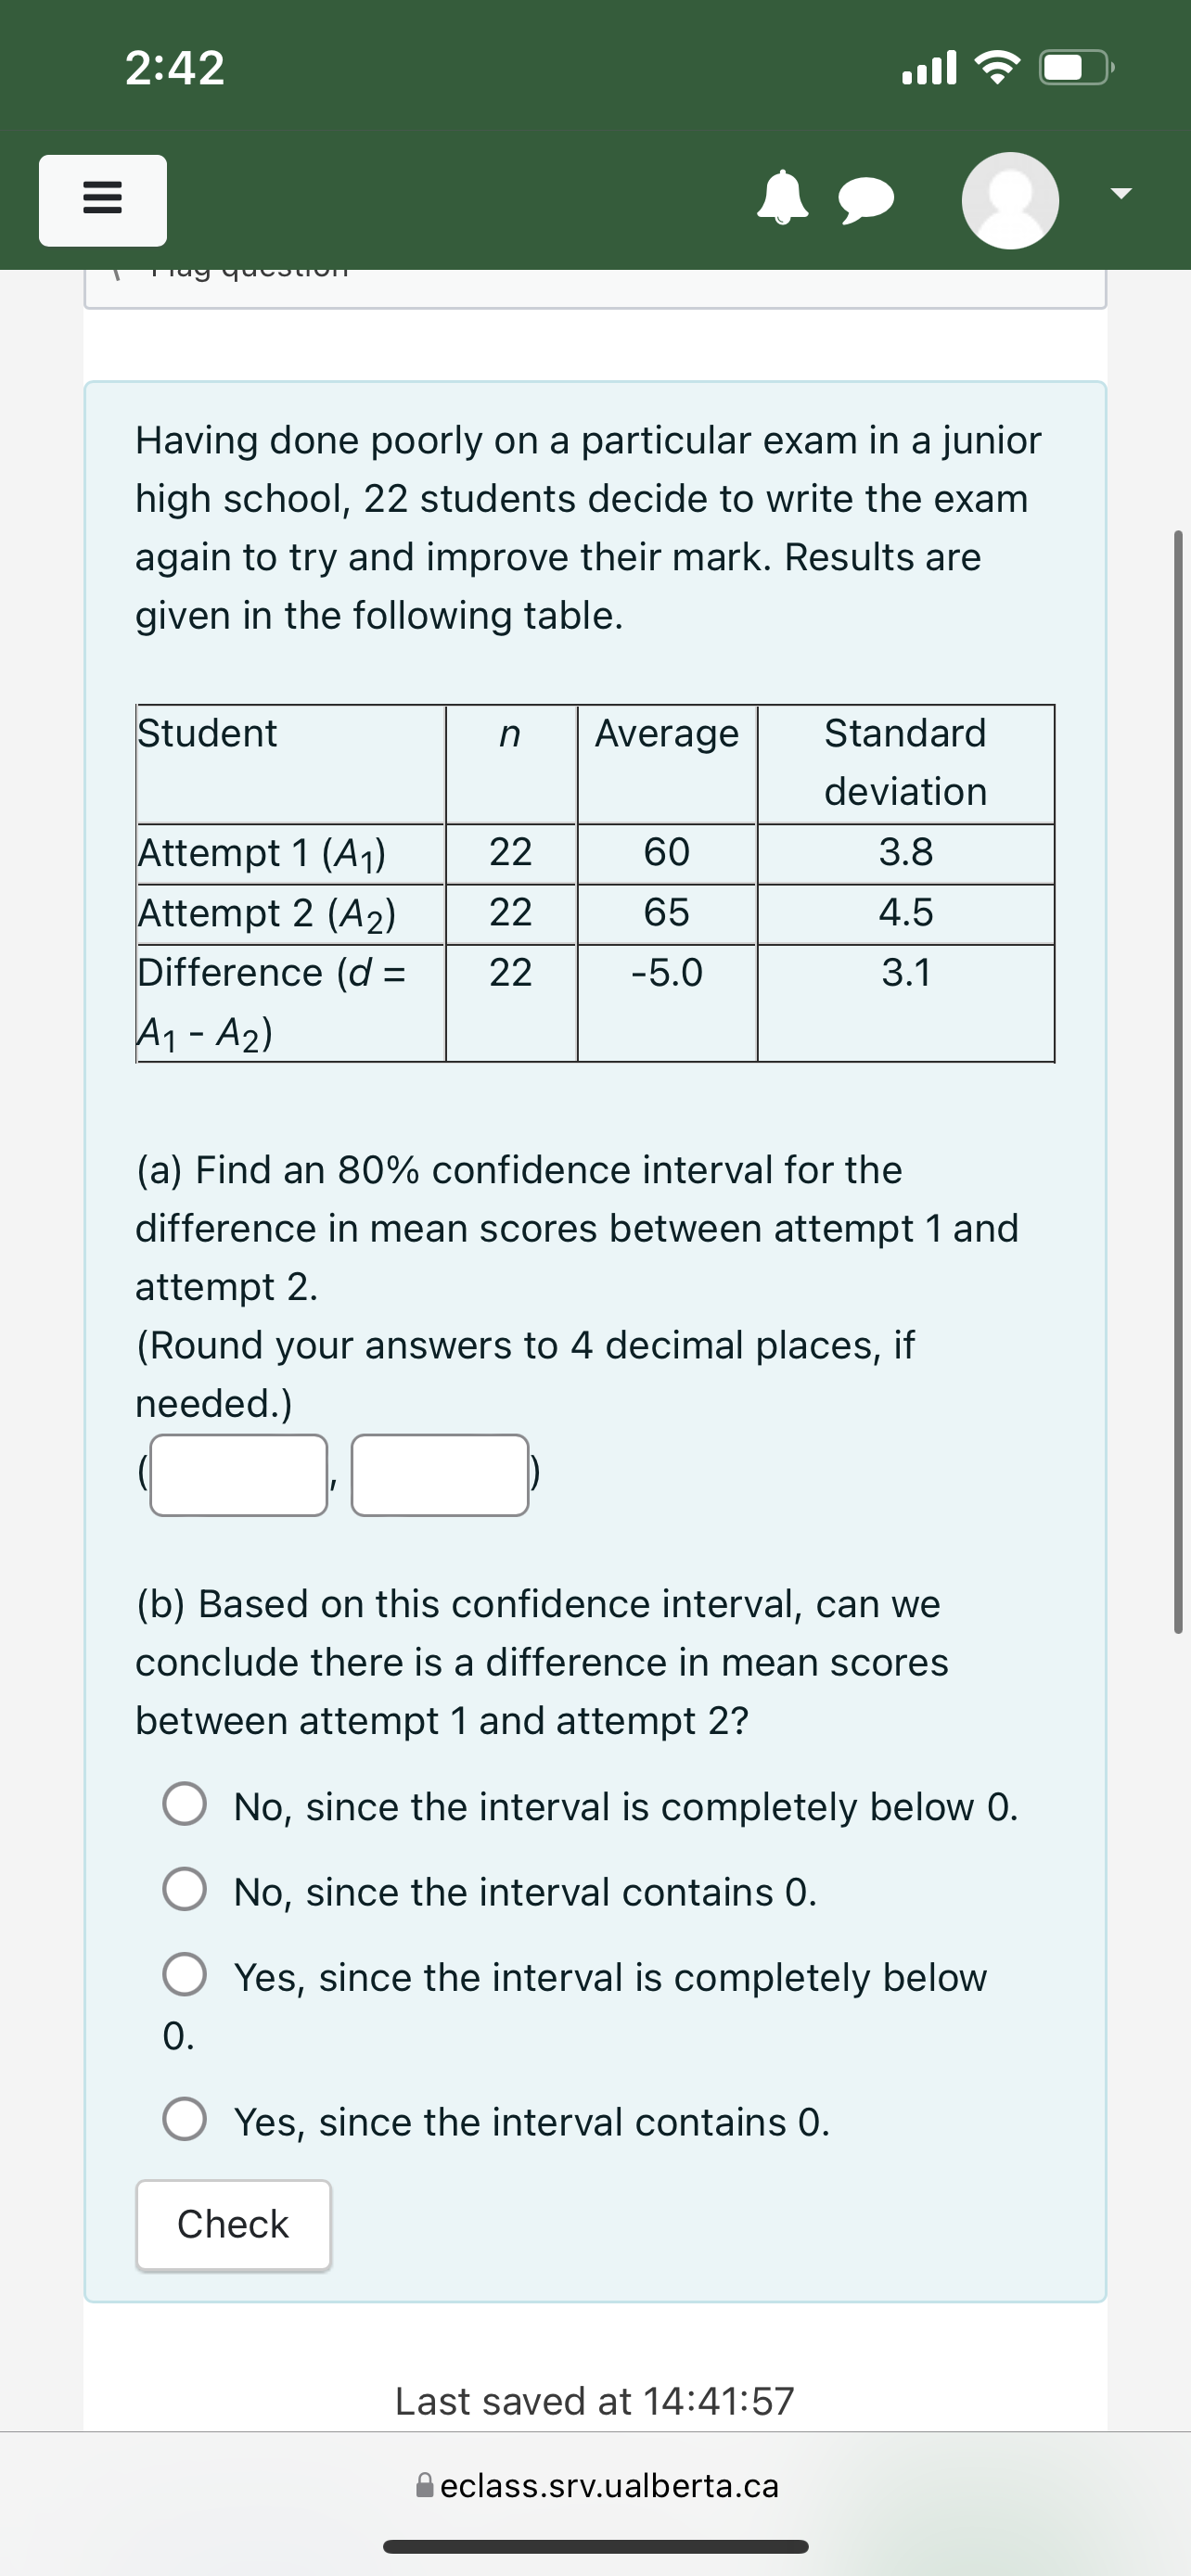
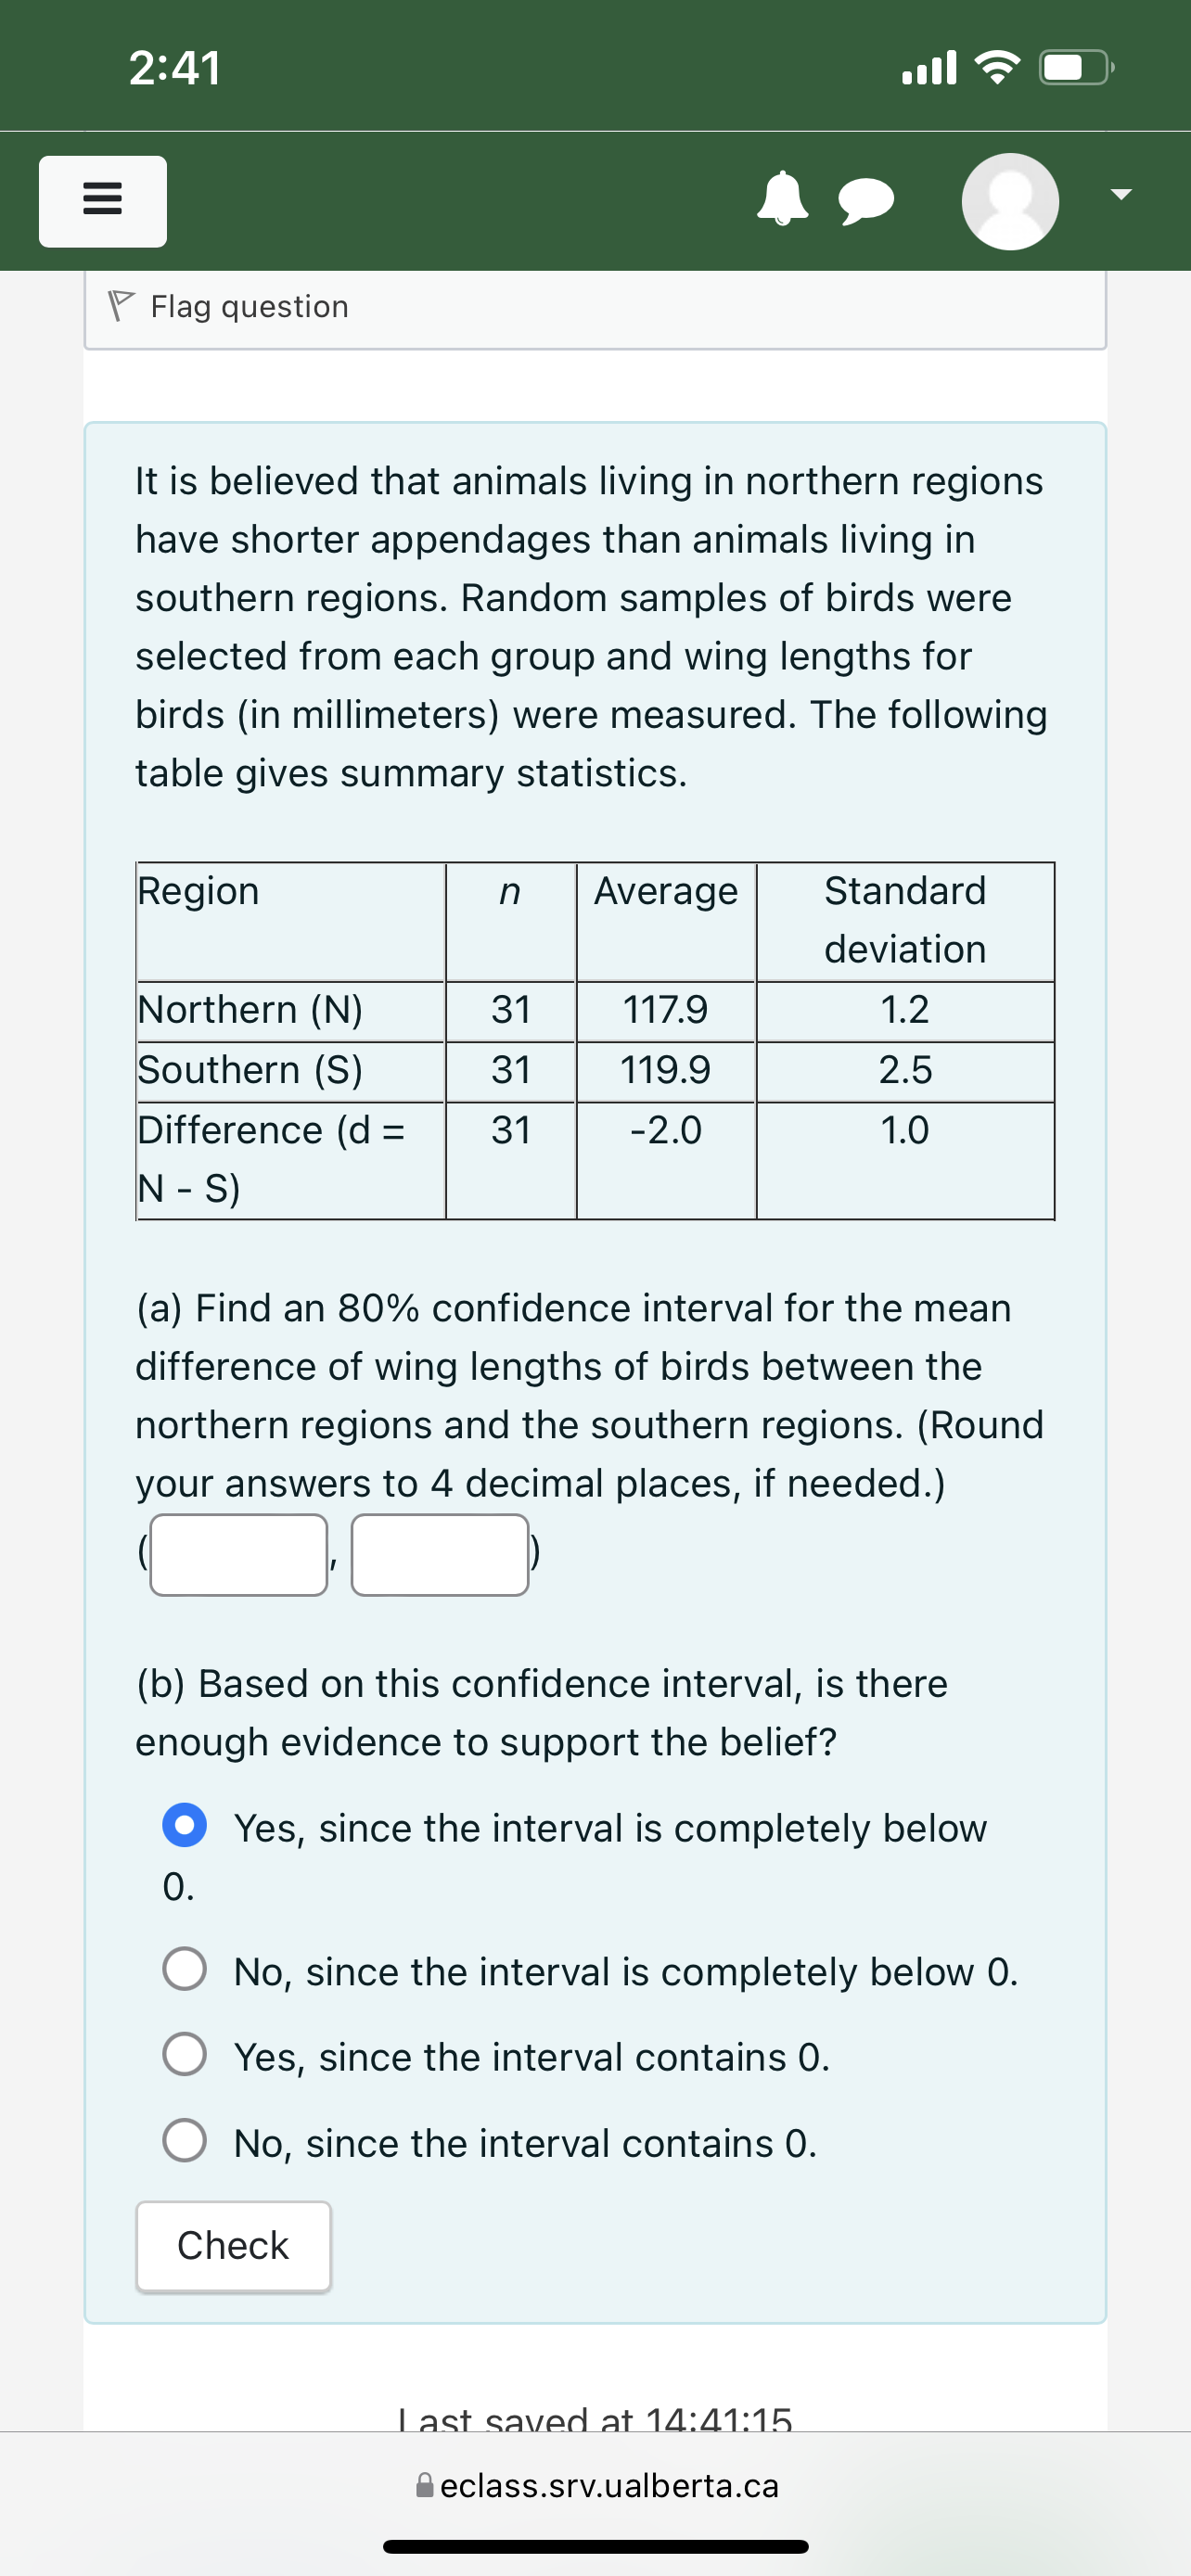
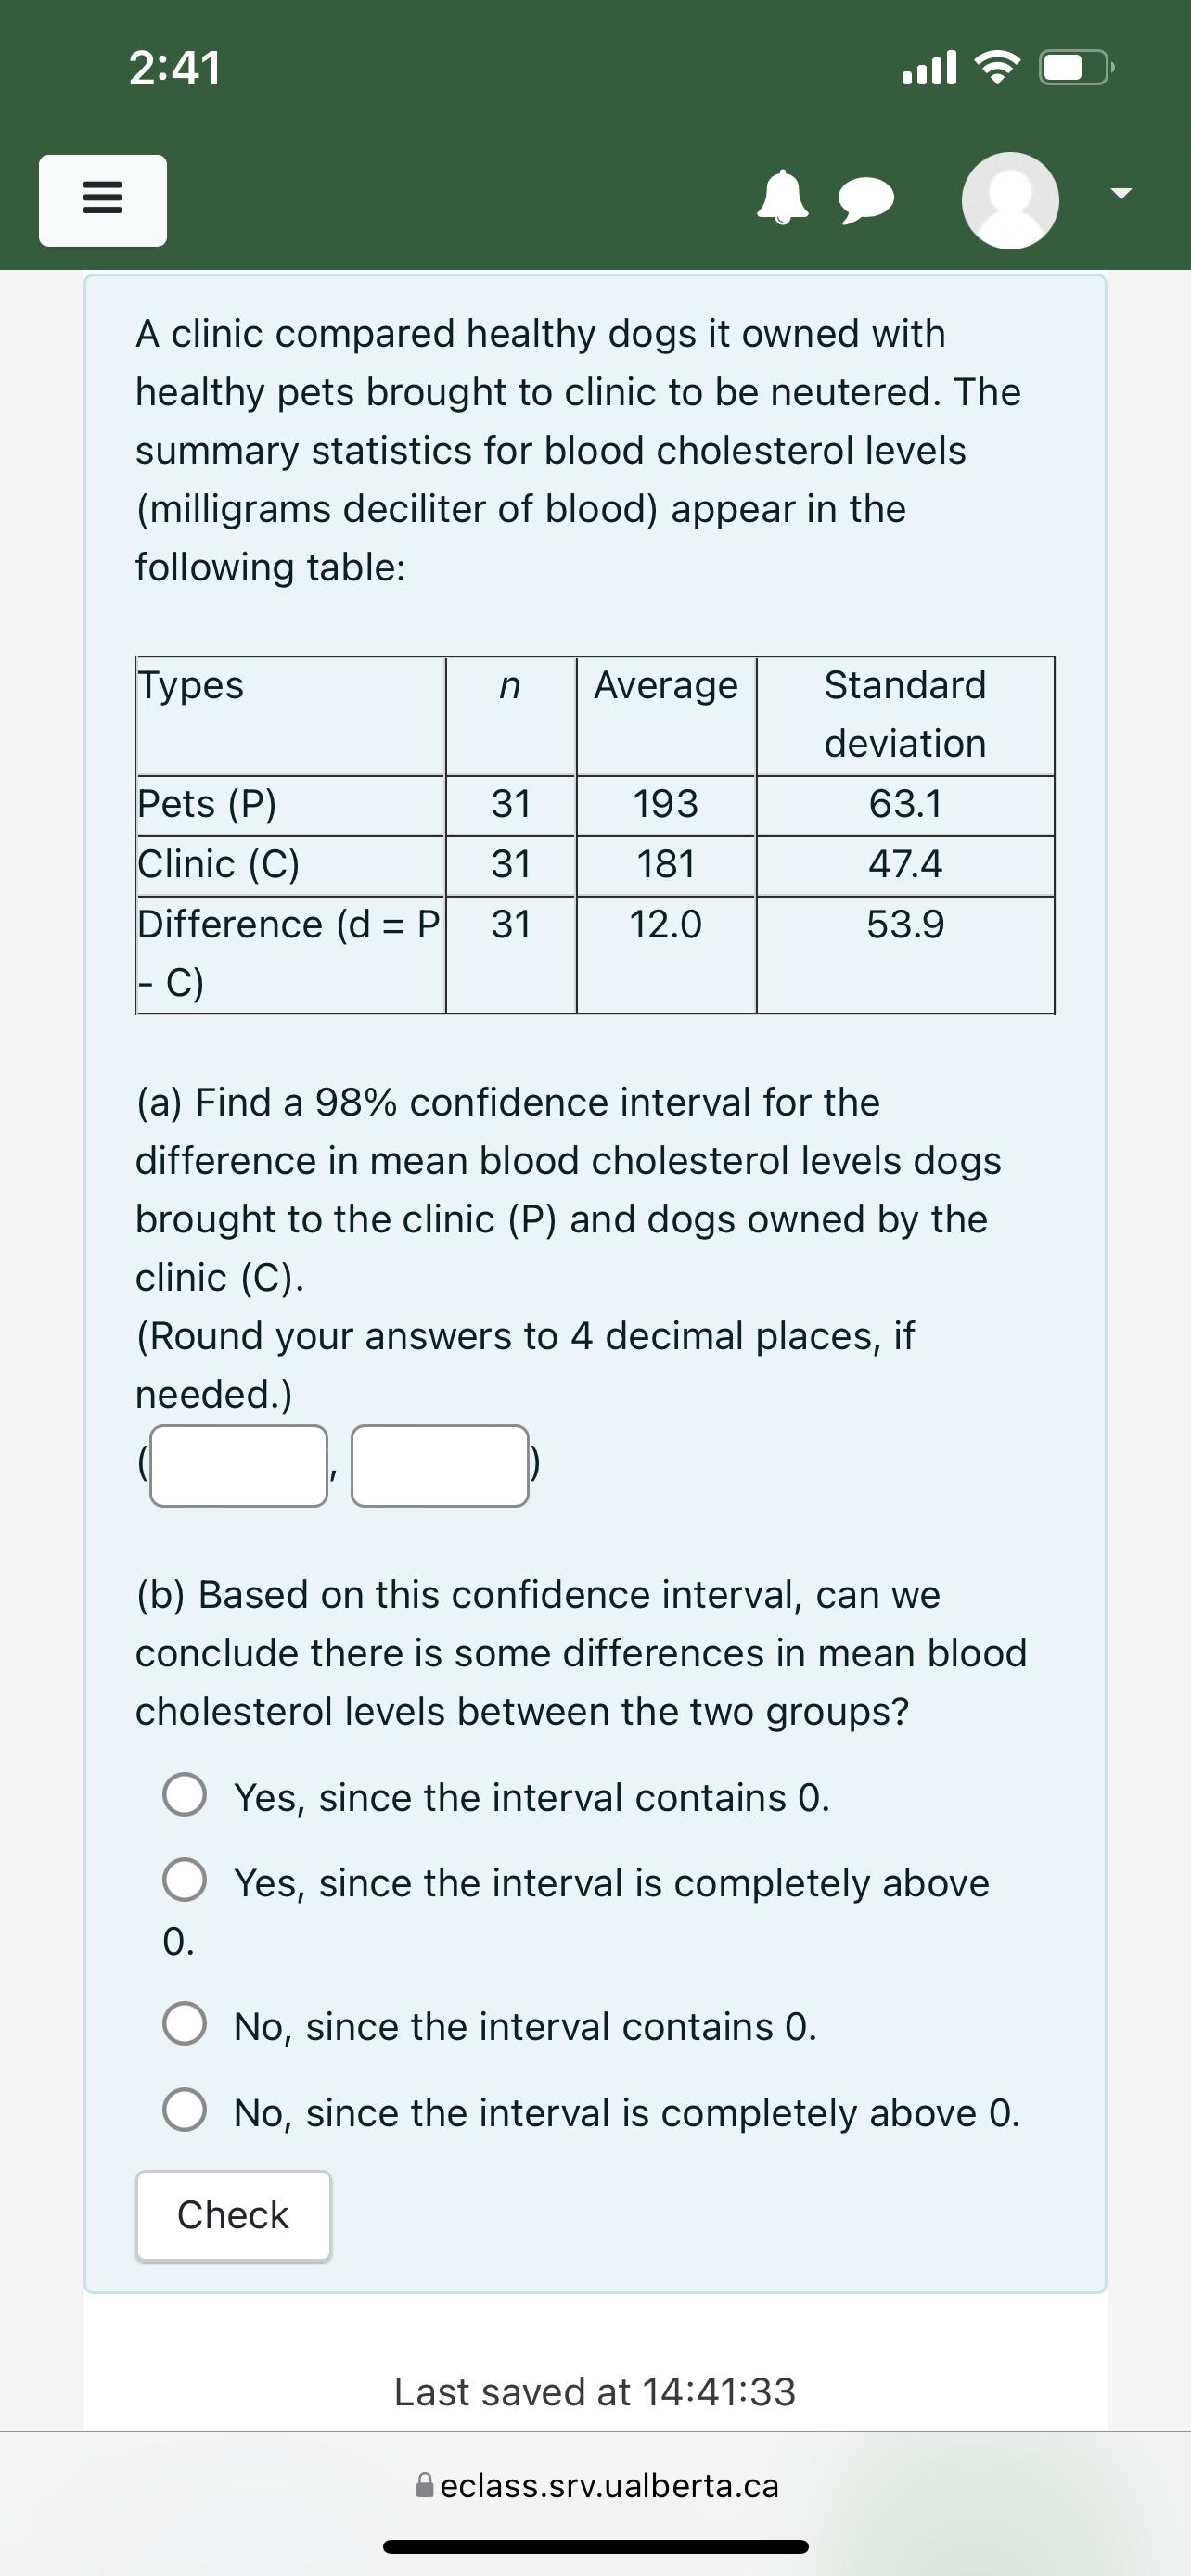
Having done poorly on a particular exam in a junior high school, 22 students decide to write the exam again to try and improve their mark. Results are given in the following table. Student n Average Standard deviation Attempt 1 (A1) 22 60 3.8 Attempt 2 (A2) 22 65 4.5 Difference (d : 22 5.0 3.1 1 - A2) (a) Find an 80% confidence interval for the difference in mean scores between attempt 1 and attempt 2. (Round your answers to 4 decimal places, if needed. ) (b) Based on this confidence interval, can we conclude there is a difference in mean scores between attempt 1 and attempt 2? O No, since the interval is completely below 0. O No, since the interval contains 0. 0 Yes, since the interval is completely below 0. 0 Yes, since the interval contains 0. Check Last saved at 14:41:57 Beclass.srv.ualberta.ca \\'7 Flag question It is believed that animals living in northern regions have shorter appendages than animals living in southern regions. Random samples of birds were selected from each group and wing lengths for birds (in millimeters) were measured. The following table gives summary statistics. Region n Average Standard deviation Northern (N) 31 117.9 1.2 Southern (8) 31 119.9 2.5 Difference (d : 31 -2.0 1.0 N - S) (a) Find an 80% confidence interval for the mean difference of wing lengths of birds between the northern regions and the southern regions. (Round your answers to 4 decimal places, if needed.) (b) Based on this confidence interval, is there enough evidence to support the belief? 0 Yes, since the interval is completely below 0. O No, since the interval is completely below 0. 0 Yes, since the interval contains 0. O No, since the interval contains 0. Check last saved at 14:41:15 Beclass.srv.ualberta.ca A clinic compared healthy dogs it owned with healthy pets brought to clinic to be neutered. The summary statistics for blood cholesterol levels (milligrams deciliter of blood) appear in the following table: Types n Average Standard deviation Pets (P) 31 193 63.1 Clinic (C) 31 181 47.4 Difference (d : P 31 12.0 53.9 _ C) (a) Find a 98% confidence interval for the difference in mean blood cholesterol levels dogs brought to the clinic (P) and dogs owned by the clinic (C). (Round your answers to 4 decimal places, if needed. ) (b) Based on this confidence interval, can we conclude there is some differences in mean blood cholesterol levels between the two groups? 0 Yes, since the interval contains 0. 0 Yes, since the interval is completely above 0. O No, since the interval contains 0. O No, since the interval is completely above 0. Check Last saved at 14:41:33 Beclass.srv.ualberta.ca
Step by Step Solution
There are 3 Steps involved in it

Get step-by-step solutions from verified subject matter experts