

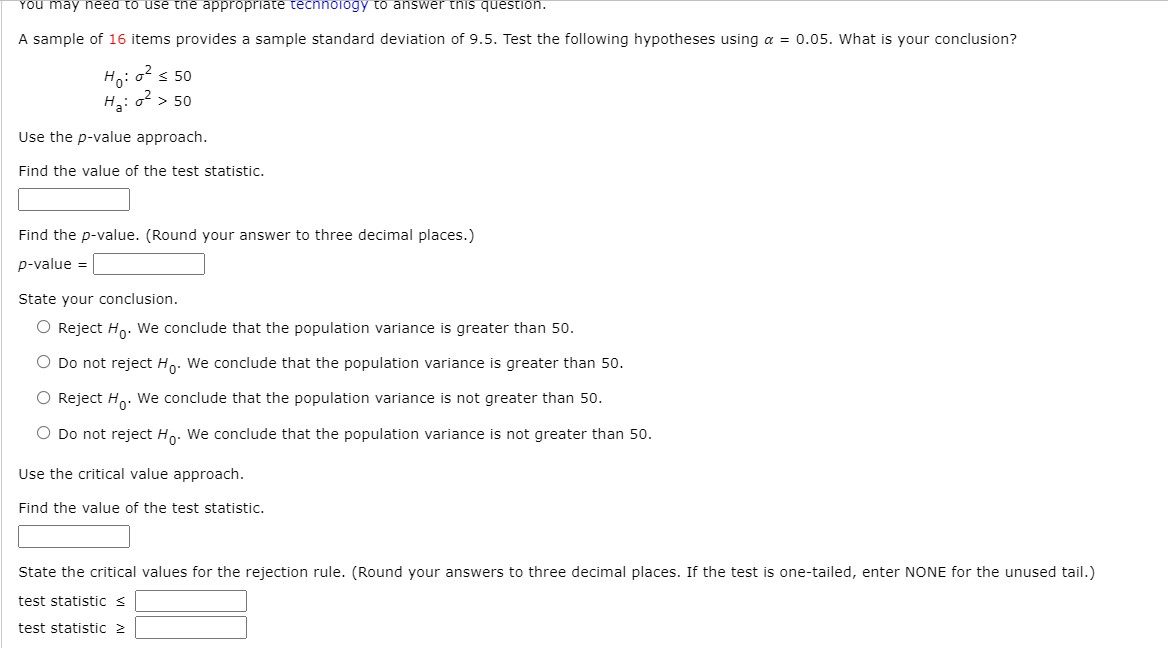
Question: Need help with Stats / Regression ... Thanks!! 10 State your conclusion. O Reject Ho. We conclude that the population variance is greater than 50.


Need help with Stats / Regression ... Thanks!!
10


![is greater than 5|]. 0 Reject H0. We conclude that the population](https://s3.amazonaws.com/si.experts.images/answers/2024/06/66782b1d1ad20_38866782b1ceba4d.jpg)

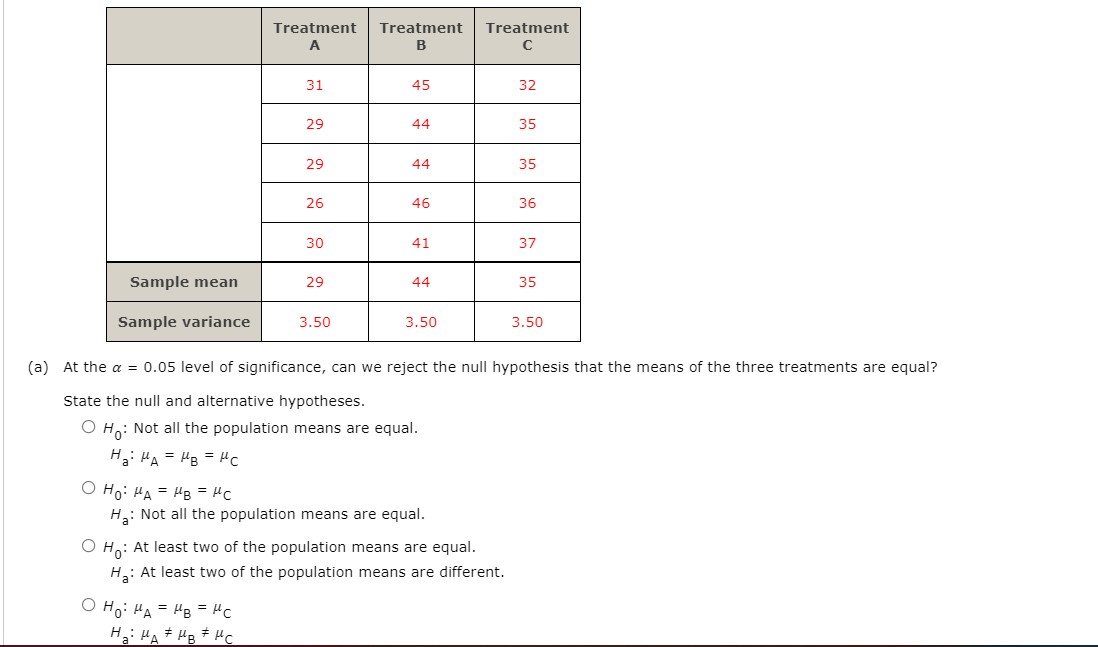
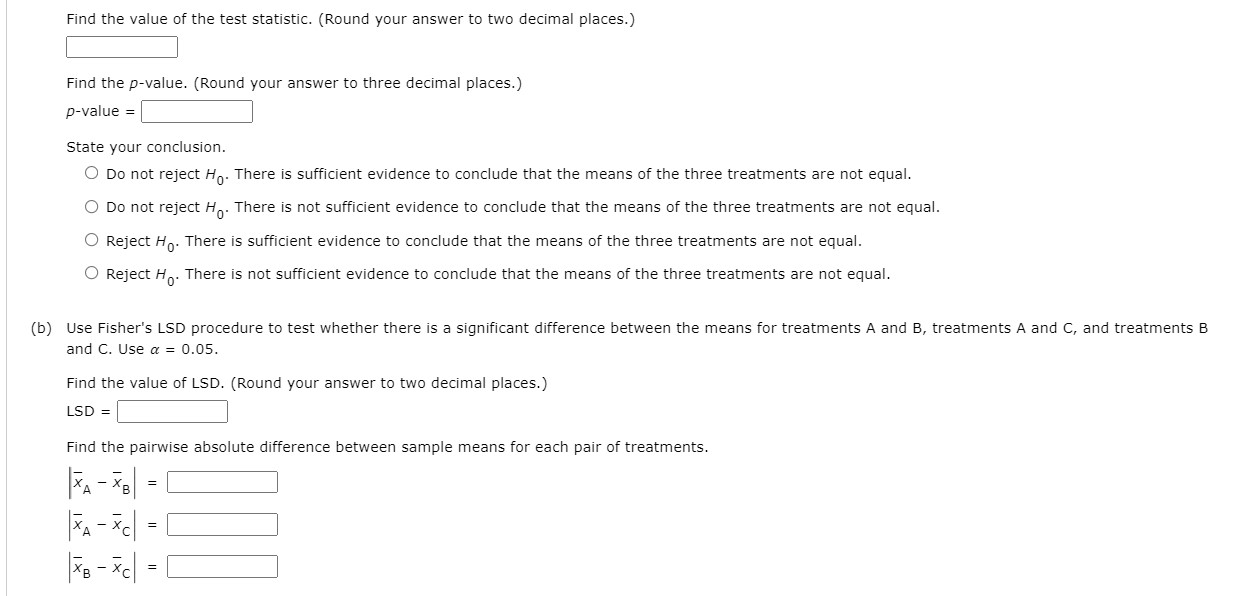
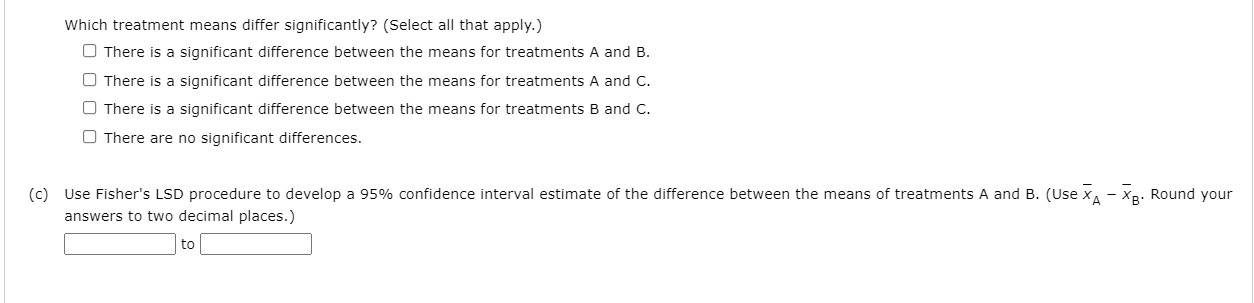
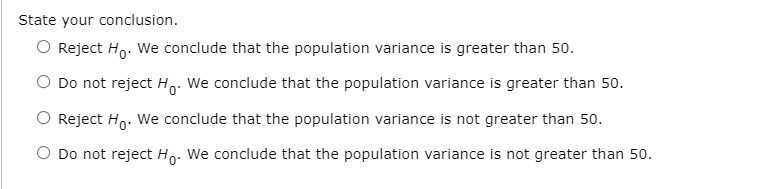
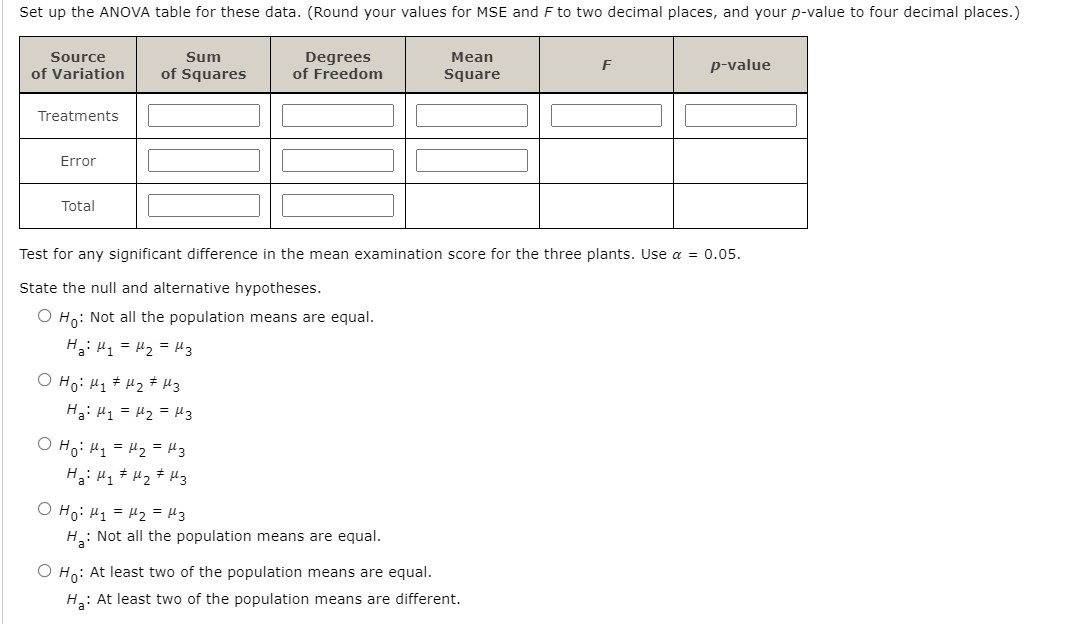
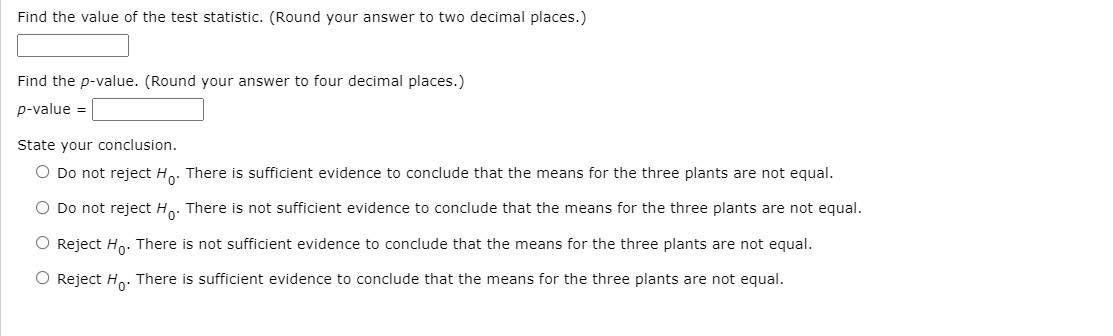
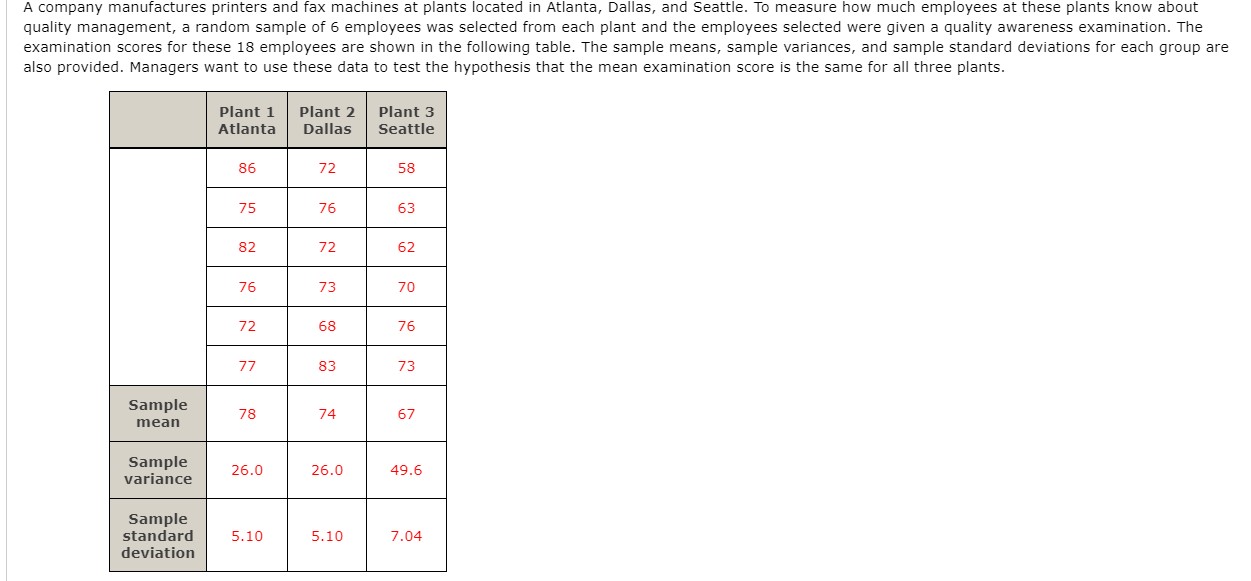
State your conclusion. O Reject Ho. We conclude that the population variance is greater than 50. O Do not reject H . We conclude that the population variance is greater than 50. O Reject Ho. We conclude that the population variance is not greater than 50. O Do not reject H . We conclude that the population variance is not greater than 50.WEBBWWW questron. A sample of 16 items provides a sample standard deviation of 9.5. Test the following hypotheses using a = 0.05. What is your conclusion? H0: 02 s so . 2 Ha. (I > 50 Use the pvalue approach. Find the value of the test statistic. E Find the pvalue. (Round your answer to three decimal places.) State your conclusion. 0 Reject H0. We conclude that the population variance is greater than 50. 0 Do not reject H0. We conclude that the population variance is greater than 5|]. 0 Reject H0. We conclude that the population variance is not greater than 50. 0 Do not reject \"'0' We conclude that the population variance is not greater than 50. Use the critical value approach. Find the value of the test statistic. E State the critical values for the rejection rule. (Round your answers to three decimal places. If the test is one-tailed, enter NONE for the unused tail.) test statistic \\:| test statistic 2 E IA Set up the ANUVA table for these data. (Round your values for MSE and Fto two decimal places, and your pvalue to four decimal places.) Treatments l l l l l Em" | || || | Total I I I I Test for any signicant difference in the mean examination score for the three plants. Use a = [1.05. State the null and alternative hypotheses. O Ho: Not all the population means are equal. Ha: \"1 = \"2 = #3 O Ho:p1#p2##3 Ha: #1 = #2 = #3 O Ho:#1 2-\"22-"3 Ha: #1 if #2 55 #3 O \"03% =F'22F'3 Ha: Not all the population means are equal. 0 Ho: At least two of the population means are equal. Ha: At least two of the population means are different. Find the value of the test statistic. (Round your answer to two decimal places.) E Find the pvalue. (Round your answer to four decimal places.) State your conclusion. 0 Do not reject H0. There is sufficient evidence to conclude that the means for the three plants are not equal. 0 Do not reject H0. There is not sufcient evidence to conclude that the means for the three plants are not equal. 0 Reject HO. There is not sufficient evidence to conclude that the means for the three plants are not equal. 0 Reject HO. There is sufcient evidence to conclude that the means for the three plants are not equal. A company manufactures printers and fax machines at plants located in Atlanta, Dallas, and Seattle. To measure how much employees at these plants know about quality management, a random sample of 6 employees was selected from each plant and the employees seletied were given a quality awareness examination. The examination scores for these 18 employees are shown in the following table. The sample means, sample variances, and sample standard deviations for each group are also provided. Managers want to use these data to test the hypothesis that the mean examination score is the same for all three plants. (a) At the a = 0.05 level of signicance, can we reject the null hypothesis that the means of the three treatments are equal? State the null and alternative hypotheses. 0 Ho: Not all the population means are equal. Ha: \"A = \"B = \"c 0 Ho: l\"A21\"|=_'.=l\"c Ha: Not all the population means are equal. 0 HD: At least two of the population means are equal. Ha: At least two of the population means are different. 0 Ho: \"A=-\"B=-\"c Ha: HA # #B # pic Find the value of the test statistic. (Round your answer to two decimal places.) Find the p-value. (Round your answer to three decimal places.) p-value = State your conclusion. O Do not reject Ho. There is sufficient evidence to conclude that the means of the three treatments are not equal. O Do not reject Ho. There is not sufficient evidence to conclude that the means of the three treatments are not equal. O Reject Ho. There is sufficient evidence to conclude that the means of the three treatments are not equal. O Reject H . There is not sufficient evidence to conclude that the means of the three treatments are not equal. (b) Use Fisher's LSD procedure to test whether there is a significant difference between the means for treatments A and B, treatments A and C, and treatments B and C. Use a = 0.05. Find the value of LSD. (Round your answer to two decimal places.) LSD = Find the pairwise absolute difference between sample means for each pair of treatments. XA - X B = X A - XC = X B - XC =Which treatment means differ significantly? (Select all that apply.) O There is a significant difference between the means for treatments A and B. O There is a significant difference between the means for treatments A and C. O There is a significant difference between the means for treatments B and C. O There are no significant differences. (c) Use Fisher's LSD procedure to develop a 95% confidence interval estimate of the difference between the means of treatments A and B. (Use X - XB. Round your answers to two decimal places.) to
Step by Step Solution
There are 3 Steps involved in it

Get step-by-step solutions from verified subject matter experts