

Question: Need help with step by step instructions for problems 1-5 please A store manager wishes to find out whether there is a relation between the
Need help with step by step instructions for problems 1-5 please
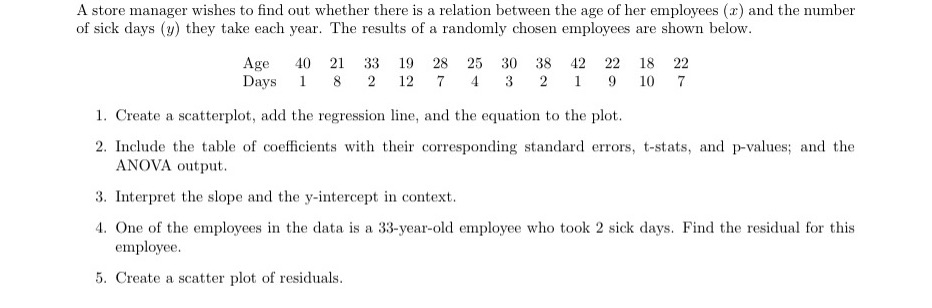
A store manager wishes to find out whether there is a relation between the age of her employees (a) and the number of sick days (y) they take each year. The results of a randomly chosen employees are shown below. Age 40 21 33 19 28 25 30 38 42 22 18 22 Days 1 8 2 12 7 4 3 2 1 9 10 7 1. Create a scatterplot, add the regression line, and the equation to the plot. 2. Include the table of coefficients with their corresponding standard errors, t-stats, and p-values; and the ANOVA output. 3. Interpret the slope and the y-intercept in context. 4. One of the employees in the data is a 33-year-old employee who took 2 sick days. Find the residual for this employee. 5. Create a scatter plot of residuals
Step by Step Solution
There are 3 Steps involved in it

Get step-by-step solutions from verified subject matter experts