Question: Need help with the following excel simulation assignment: a. Find the FV of $1,000 invested to earn 10% annually 5 years from now. Answer this
Need help with the following excel simulation assignment:
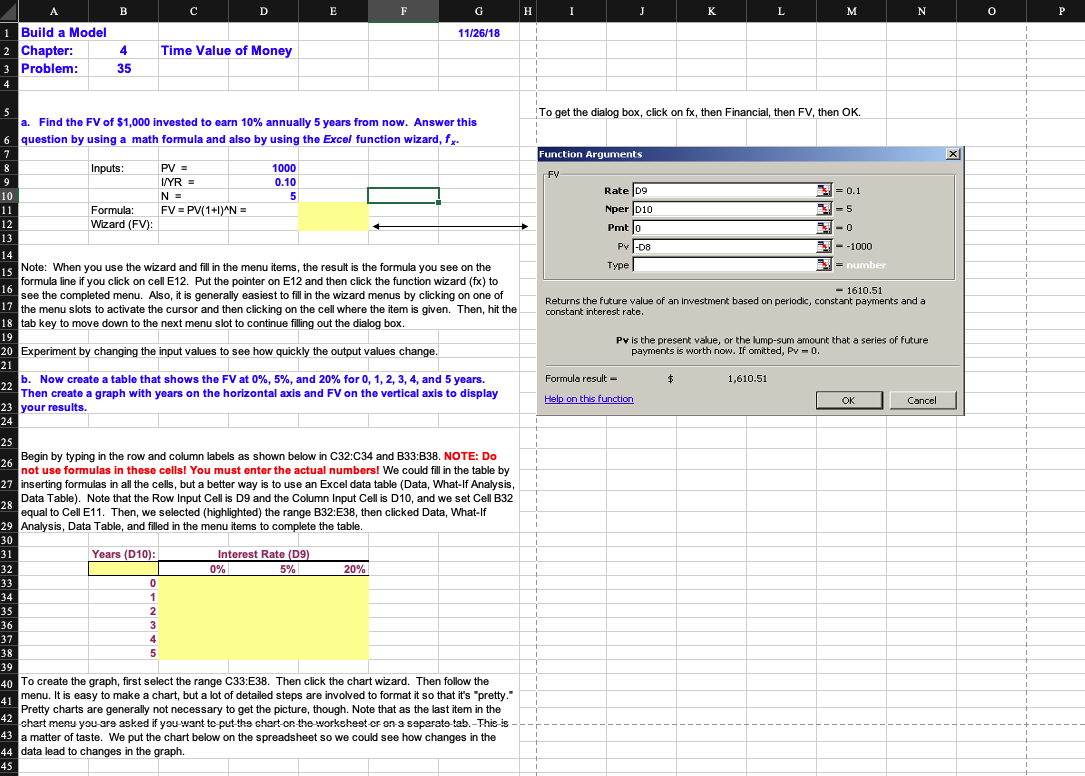
| a. Find the FV of $1,000 invested to earn 10% annually 5 years from now. Answer this question by using a math formula and also by using the Excel function wizard, fx. |
| b. Now create a table that shows the FV at 0%, 5%, and 20% for 0, 1, 2, 3, 4, and 5 years. Then create a graph with years on the horizontal axis and FV on the vertical axis to display your results. |
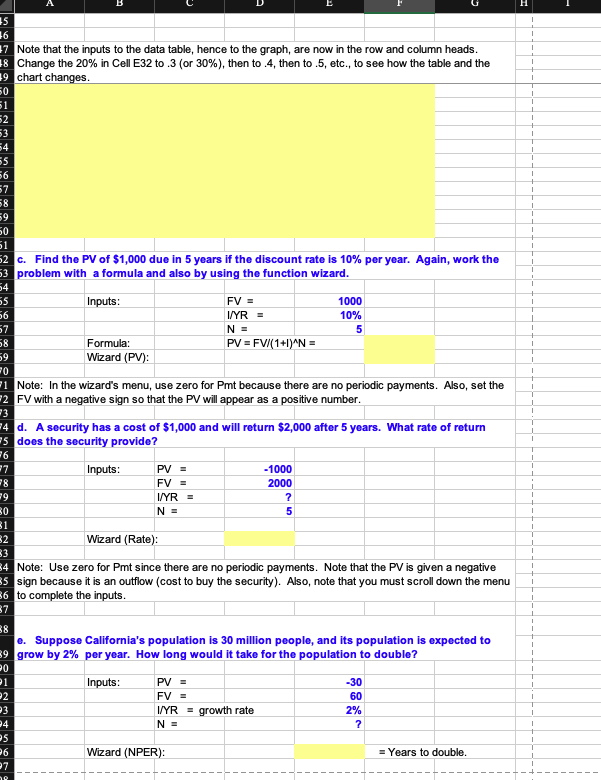
| c. Find the PV of $1,000 due in 5 years if the discount rate is 10% per year. Again, work the problem with a formula and also by using the function wizard. |
| d. A security has a cost of $1,000 and will return $2,000 after 5 years. What rate of return does the security provide? |
| e. Suppose Californias population is 30 million people, and its population is expected to grow by 2% per year. How long would it take for the population to double? |
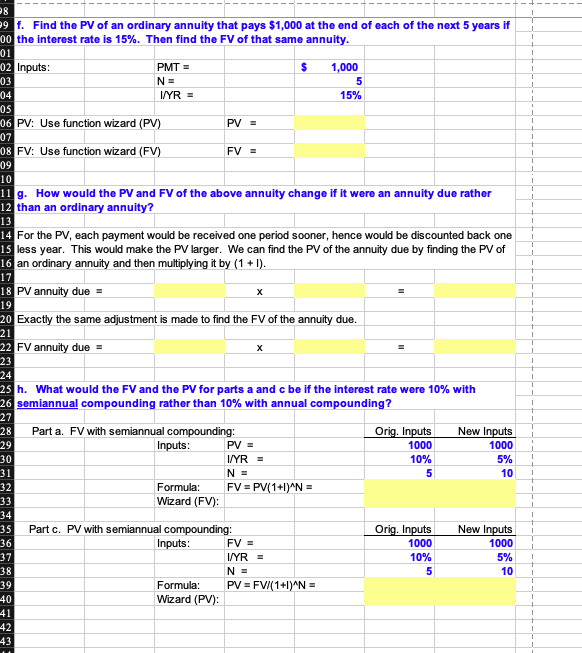
| f. Find the PV of an ordinary annuity that pays $1,000 at the end of each of the next 5 years if the interest rate is 15%. Then find the FV of that same annuity. |
| g. How would the PV and FV of the above annuity change if it were an annuity due rather than an ordinary annuity? |
| h. What would the FV and the PV for parts a and c be if the interest rate were 10% with semiannual compounding rather than 10% with annual compounding? |
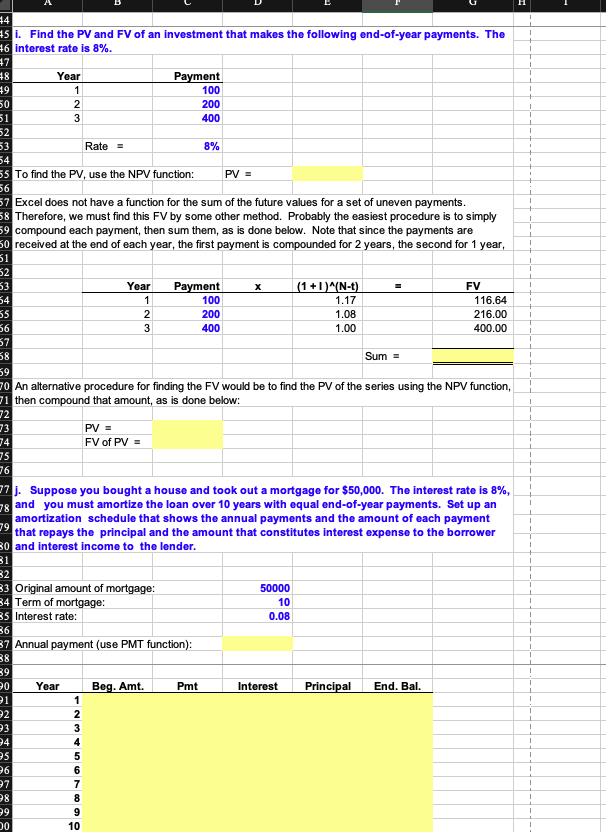
| i. Find the PV and FV of an investment that makes the following end-of-year payments. The interest rate is 8%. |
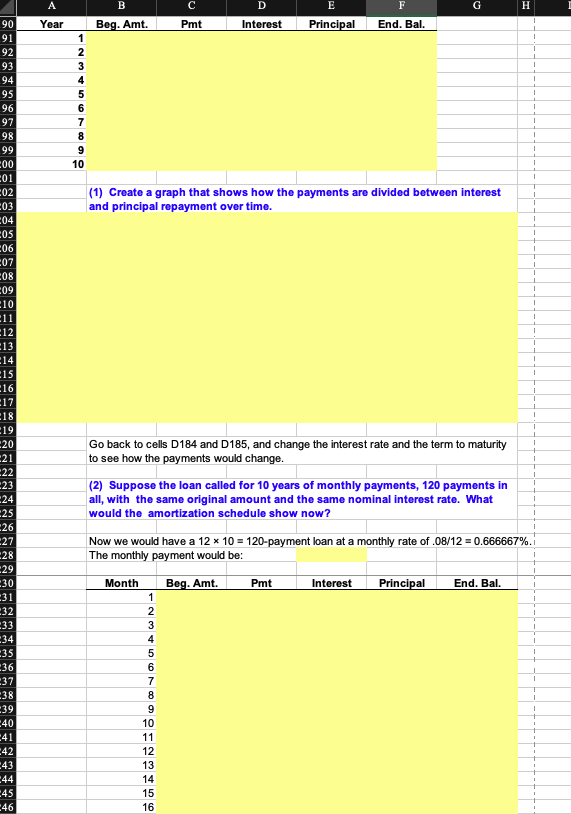
| j. Suppose you bought a house and took out a mortgage for $50,000. The interest rate is 8%, and you must amortize the loan over 10 years with equal end-of-year payments. Set up an amortization schedule that shows the annual payments and the amount of each payment that repays the principal and the amount that constitutes interest expense to the borrower and interest income to the lender. |
A B D E F G H I K L M . N O P 11/26/18 1 Build a Model 2 Chapter: 3 Problem: 4 Time Value of Money 35 4 To get the dialog box, click on fx, then Financial, then FV, then OK. Function Arguments 5 a. Find the FV of $1,000 invested to earn 10% annually 5 years from now. Answer this 6 question by using a math formula and also by using the Excel function wizard, fx 7 8 Inputs: PV = 1000 9 I/YR = 0.10 10 N = 5 11 Formula: FV = PV(1+1) N = 12 Wizard (FV): 13 FV = 0.1 = = 5 Rate D9 Nper 010 Pmt lo Pv1-08 2-0 - -1000 14 Type = number 16 15 Note: When you use the wizard and fill in the menu items, the result is the formula you see on the formula line if you click on cell E12. Put the pointer on E12 and then click the function wizard (fx) to see the completed menu. Also, it is generally easiest to fill in the wizard menus by clicking on one of 17 the menu slots to activate the cursor and then clicking on the cell where the item is given. Then, hit the 18 tab key to move down to the next menu slot to continue filling out the dialog box. - 1610.51 Returns the future value of an investment based on periodic, constant payments and a constant interest rate. 19 20 Experiment by changing the input values to see how quickly the output values change. Pv is the present value, or the lump-sum amount that a series of future payments is worth now. If omitted, Pv - 0. 21 Formula result 1,610.51 b. Now create a table that shows the FV at 0%, 5%, and 20% for 0, 1, 2, 3, 4, and 5 years. Then create a graph with years on the horizontal axis and FV on the vertical axis to display 23 your results. 24 Help on this function OK Cancel 25 1 Begin by typing in the row and column labels as shown below in C32:C34 and B33:B38. NOTE: Do 26 not use formulas in these cells! You must enter the actual numbers! We could fill in the table by 27 inserting formulas in all the cells, but a better way is to use an Excel data table (Data, What-If Analysis, Data Table). Note that the Row Input Cell is D9 and the Column Input Cell is D10, and we set Cell B32 28 equal to Cell E11. Then, we selected (highlighted) the range B32:E38, then clicked Data, What-If 29 Analysis, Data Table, and filled in the menu items to complete the table. 30 31 Years (D10): Interest Rate (D9) 32 0% 5% 20% 33 0 1 34 1 35 2 36 3 37 4 38 5 39 40 To create the graph, first select the range C33:E38. Then click the chart wizard. Then follow the 41 menu. It is easy to make a chart, but a lot of detailed steps are involved to format it so that it's pretty." Pretty charts are generally not necessary to get the picture, though. Note that as the last item in the 42 shart meny you are asked if you want to put the chart on the workehest or on a separate tab.-This-is 43 a matter of taste. We put the chart below on the spreadsheet so we could see how changes in the 44 data lead to changes in the graph. 45 35 16 7 Note that the inputs to the data table, hence to the graph, are now in the row and column heads. 18 Change the 20% in Cell E32 to 3 (or 30%), then to.4, then to.5, etc., to see how the table and the 19 chart changes. 50 51 2 53 54 55 56 7 58 59 50 51 2 c. Find the PV of $1,000 due in 5 years if the discount rate is 10% per year. Again, work the 3 problem with a formula and also by using the function wizard. 54 55 Inputs: FV = 1000 56 I/YR = 10% 5 57 N = 58 PV = FV/(1+1)^N = Formula: Wizard (PV): 59 0 11 Note: In the wizard's menu, use zero for Pmt because there are no periodic payments. Also, set the 2 FV with a negative sign so that the PV will appear as a positive number. 14 d. A security has a cost of $1,000 and will return $2,000 after 5 years. What rate of return 5 does the security provide? 13 26 17 Inputs: PV = -1000 78 FV = 2000 19 I/YR = ? O N = 5 31 WN Wizard (Rate) 4 Note: Use zero for Pmt since there are no periodic payments. Note that the PV is given a negative 5 sign because it is an outflow (cost to buy the security). Also, note that you must scroll down the menu 6 to complete the inputs. 37 e. Suppose California's population is 30 million people, and its population is expected to 9 grow by 2% per year. How long would it take for the population to double? 0 P1 Inputs: PV = -30 2 FV = 60 P3 2% I/YR = growth rate N = 24 ? 25 6 Wizard (NPER): = Years to double. 27 10 P8 9 f. Find the PV of an ordinary annuity that pays $1,000 at the end of each of the next 5 years if 00 the interest rate is 15%. Then find the FV of that same annuity. 01 02 Inputs: PMT = $ 03 N= I/YR = 1,000 5 15% 04 05 06 PV: Use function wizard (PV) PV = 07 08 FV: Use function wizard (FV) FV = 09 10 13 11 g. How would the PV and FV of the above annuity change if it were an annuity due rather 12 than an ordinary annuity? 14 For the PV, each payment would be received one period sooner, hence would be discounted back one 15 less year. This would make the PV larger. We can find the PV of the annuity due by finding the PV of 16 an ordinary annuity and then multiplying it by (1 + 1). 18 PV annuity due = 20 Exactly the same adjustment is made to find the FV of the annuity due. 22 FV annuity due = 17 19 21 23 24 25 h. What would the FV and the PV for parts a and cbe if the interest rate were 10% with 26 semiannual compounding rather than 10% with annual compounding? 27 28 Orig. Inputs New Inputs 1000 29 1000 30 10% 5% Part a. FV with semiannual compounding: Inputs: PV = I/YR = NE Formula: FV = PV(1+1)^N = Wizard (FV): 31 5 10 32 33 34 35 Orig. Inputs 1000 New Inputs 1000 36 37 10% 5% Part c. PV with semiannual compounding: Inputs: FV = I/YR = N = Formula: PV = FV/(1+1)^N = Wizard (PV) 38 5 10 39 40 41 42 43 4 1 45 i. Find the PV and FV of an investment that makes the following end-of-year payments. The 16 interest rate is 8%. 27 48 Year Payment 100 79 1 1 50 2 200 51 3 400 52 1 53 Rate = 8% 54 55 To find the PV, use the NPV function: PV = 56 1 57 Excel does not have a function for the sum of the future values for a set of uneven payments. 58 Therefore, we must find this FV by some other method. Probably the easiest procedure is to simply 59 compound each payment, then sum them, as is done below. Note that since the payments are 50 received at the end of each year, the first payment is compounded for 2 years, the second for 1 year, 1 51 52 53 Year Payment 100 (1 +1)^(N-1). FV 54 1 1.17 116.64 55 200 1.08 216.00 56 400 1.00 400.00 57 58 Sum = 1 59 70 An alternative procedure for finding the FV would be to find the PV of the series using the NPV function, 71 then compound that amount, as is done below: 1 72 73 PV = 1 74 FV of PV = 75 1 76 1 78 77j. Suppose you bought a house and took out a mortgage for $50,000. The interest rate is 8%, and you must amortize the loan over 10 years with equal end-of-year payments. Set up an amortization schedule that shows the annual payments and the amount of each payment that repays the principal and the amount that constitutes interest expense to the borrower 30 and interest income to the lender. 79 31 32 50000 33 Original amount of mortgage: 34 Term of mortgage: 35 Interest rate: 10 1 0.08 1 36 1 87 Annual payment (use PMT function): 38 39 1 20 Year Beg. Amt Pmt Interest Principal End. Bal. 1 21 1 1 2 23 1 24 1 25 1 26 O O O O OWN 27 7 1 8 1 20 A B D E F G H 90 Year Beg. Amt. Pmt Interest Principal End. Bal. 91 1 92 2 93 3 94 4 95 5 96 6 97 7 98 8 99 9 C00 10 C01 CO2 (1) Create a graph that shows how the payments are divided between interest and principal repayment over time. CO3 C04 COS C06 07 C08 C09 10 11 12 13 14 15 16 17 18 19 20 Go back to cells D184 and D185, and change the interest rate and the term to maturity to see how the payments would change. 21 22 23 24 (2) Suppose the loan called for 10 years of monthly payments, 120 payments in all, with the same original amount and the same nominal interest rate. What would the amortization schedule show now? 25 26 27 Now we would have a 12 * 10 = 120-payment loan at a monthly rate of .08/12 = 0.666667%. The monthly payment would be: 28 29 30 Month Beg. Amt. Pmt Interest Principal End. Bal. 31 1 32 2 33 3 34 4 35 5 36 6 37 7 38 8 39 9 -40 41 -42 -43 glQB=BB 44 45 -46 75 05 06 76 07 77 08 78 09 79 10 80 11 81 12 82 13 83 14 84 15 85 16 86 17 87 18 88 19 89 20 90 21 91 22 92 23 93 24 94 25 95 26 96 27 97 28 98 29 99 30 100 31 101 32 102 33 103 34 104 35 105 36 106 37 107 38 108 39 109 40 110 41 111 42 112 43 113 44 114 45 115 46 116 47 117 48 118 49 119 50 120 51 52 53


