

Question: Need help with the question above. When you run the function it is suppose to ouput this plot. A spreadsheet popdata xls stores the population
Need help with the question above. When you run the function it is suppose to ouput this plot. 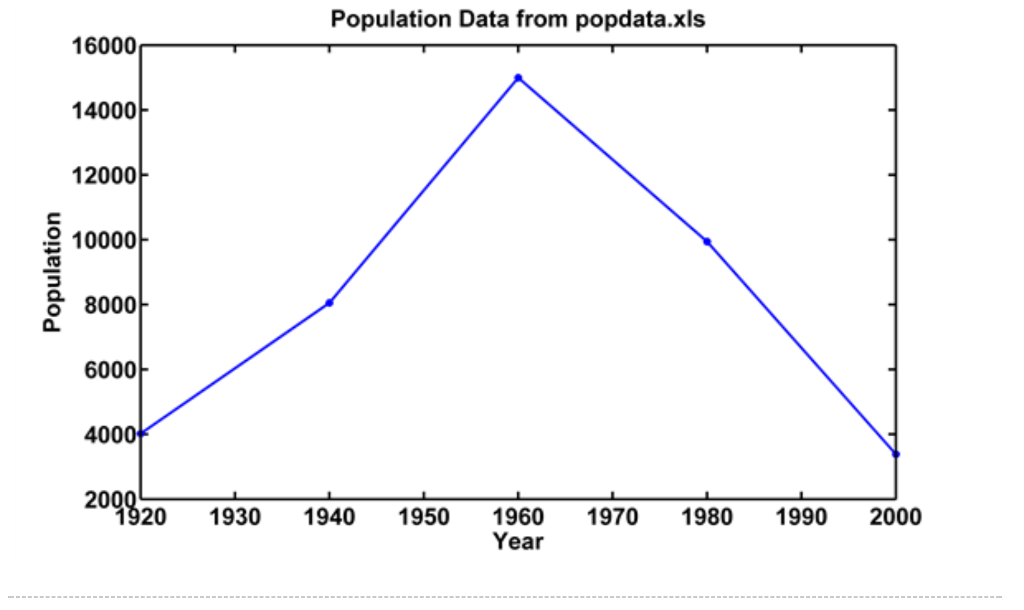
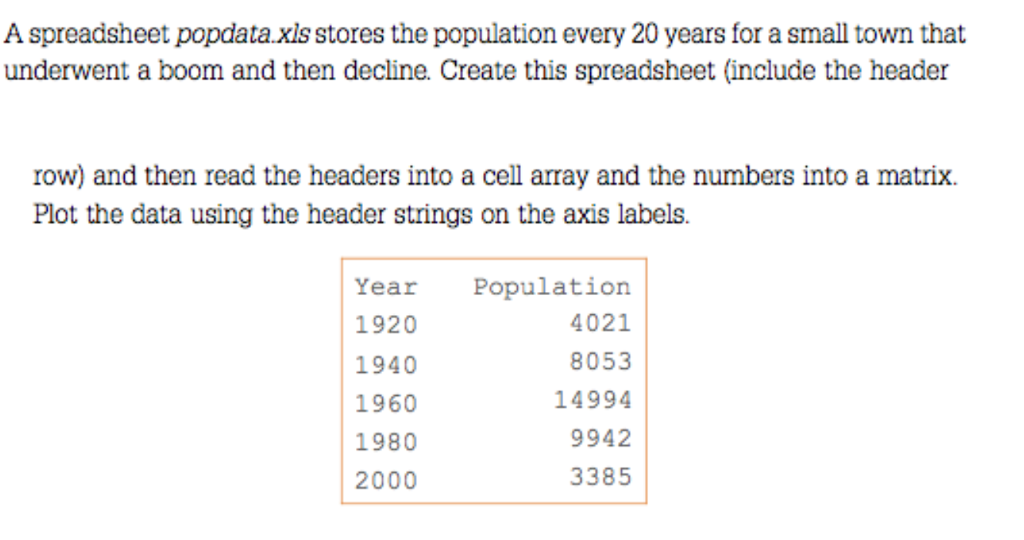
A spreadsheet popdata xls stores the population every 20 years for a small town that underwent a boom and then decline. Create this spreadsheet (include the header row) and then read the headers into a cell array and the numbers into a matrix. Plot the data using the header strings on the axis labels. Year Population 1920 1940 1960 1980 2000 4021 8053 14994 9942 3385
Step by Step Solution
There are 3 Steps involved in it
1 Expert Approved Answer
Step: 1 Unlock

Question Has Been Solved by an Expert!
Get step-by-step solutions from verified subject matter experts
Step: 2 Unlock
Step: 3 Unlock