

Question: Need help with the question below 11:00 post.blackboard.com E Post University Blackboard Unit 2 DB: Supply and Demand There is currently 1 thread in this
Need help with the question below
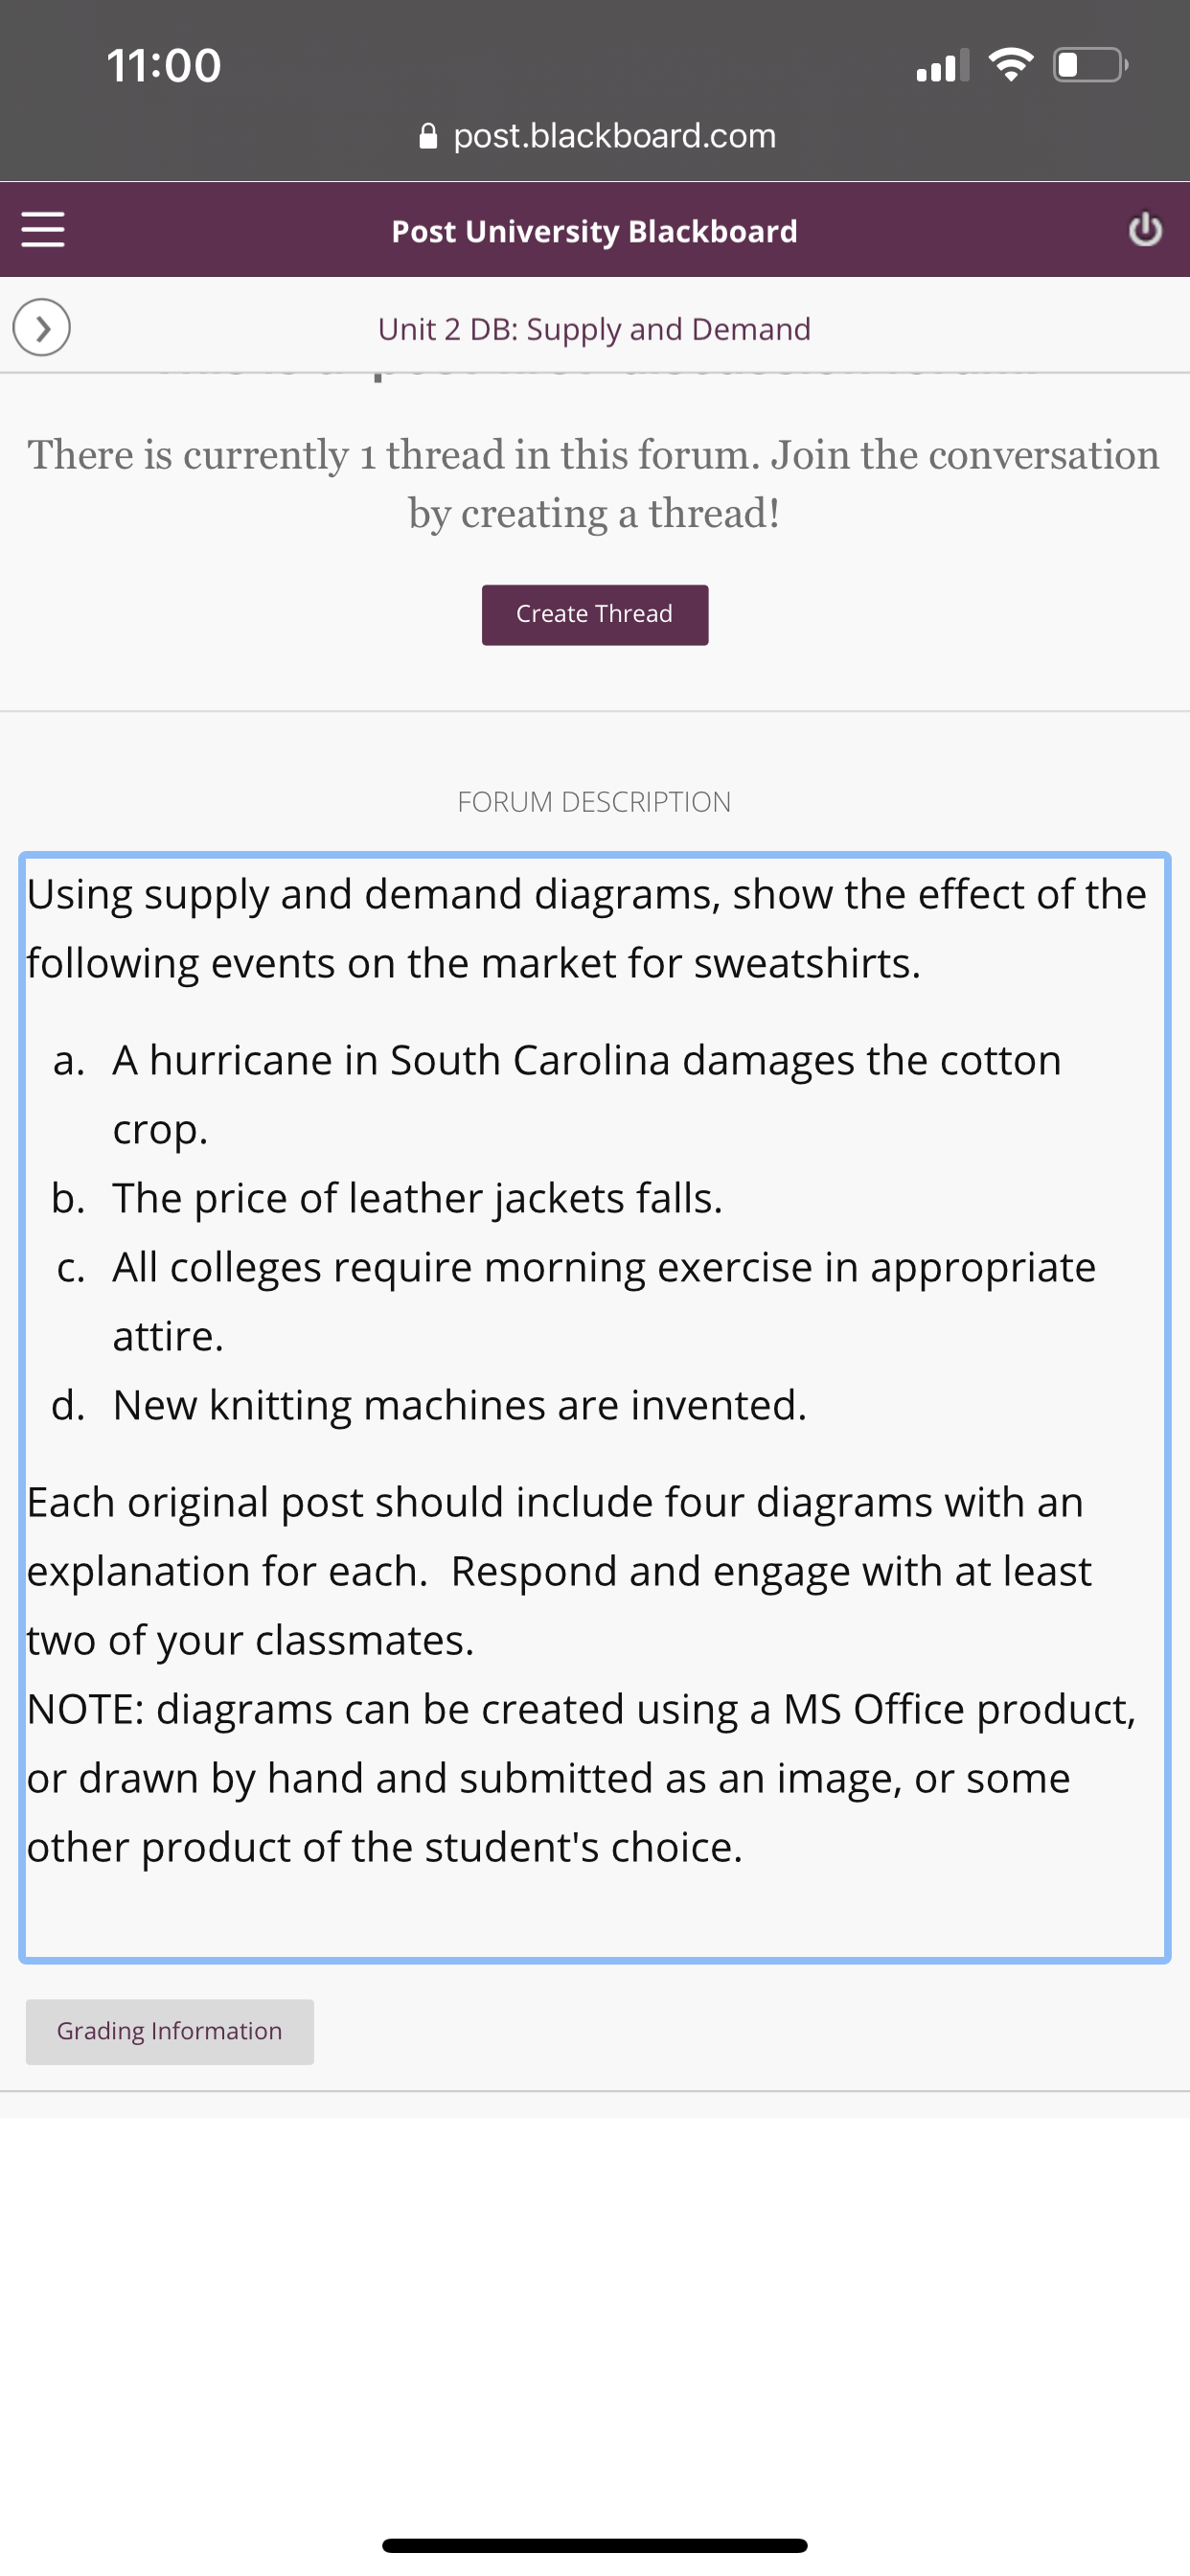
11:00 post.blackboard.com E Post University Blackboard Unit 2 DB: Supply and Demand There is currently 1 thread in this forum. Join the conversation by creating a thread! Create Thread FORUM DESCRIPTION Using supply and demand diagrams, show the effect of the following events on the market for sweatshirts. a. A hurricane in South Carolina damages the cotton crop. b. The price of leather jackets falls. c. All colleges require morning exercise in appropriate attire. d. New knitting machines are invented. Each original post should include four diagrams with an explanation for each. Respond and engage with at least two of your classmates. NOTE: diagrams can be created using a MS Office product, or drawn by hand and submitted as an image, or some other product of the student's choice. Grading Information
Step by Step Solution
There are 3 Steps involved in it

Get step-by-step solutions from verified subject matter experts