

Question: Need Help with the Stata commands in this exercise. Much Appreciated. 4. Randomized Evaluation - Estimating Racial Discrimination in the Labor Market (STATA exercise, 33
Need Help with the Stata commands in this exercise. Much Appreciated.
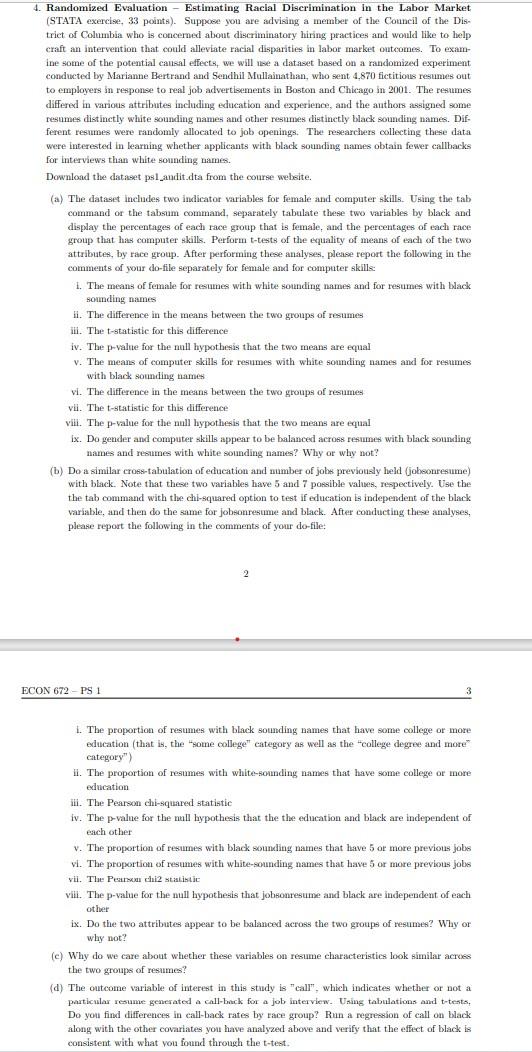
4. Randomized Evaluation - Estimating Racial Discrimination in the Labor Market (STATA exercise, 33 points). Suppose you are advising a member of the Council of the Dis- trict of Columbia who is concerned about discriminatory hiring practices and would like to help craft an intervention that could alleviate racial disparities in labor market outcomes. To exam ine some of the potential causal effects, we will use a dataset based on a randomized experiment conducted by Marianne Bertrand and Sendhil Mullainathan, who sent 4.870 fictitious resumes out to employers in response to real job advertisements in Boston and Chicago in 2001. The resumes differed in various attributes including education and experience, and the authors assigned some resumes distinctly white sounding names and other resumes distinctly black sounding names. Dif- ferent resumes were randomly allocated to job openings. The researchers collecting these data were interested in learning whether applicants with black sounding names obtain fewer callhacks for interviews than white sounding names . Download the dataset pslandit.dta from the course website. (a) The dataset includes two indicator variables for female and computer skills. Using the tab command or the tabsum command, separately tabulate these two variables by black display the percentages of each race group that is female, and the percentages of each race group that has computer skills. Perform t-tests of the equality of means of each of the two attributes, by race group. After performing these analyses, please report the following in the comments of your do-file separately for female and for computer skills: 1. The means of female for resumes with white sounding names and for resumes with black sounding names il. The difference in the means between the two groups of resumes ill. The t-statistic for this difference iv. The p-value for the null hypothesis that the two means are equal v. The means of computer skills for resumes with white sounding names and for resumes with black sounding names vl. The difference in the means between the two groups of resumes vil. The t-statistic for this difference vill. The p-value for the null hypothesis that the two means are equal lx. Do gender and computer skills appear to be balanced across resumes with black sounding names and resumes with white sounding names? Why or why not? (b) Do a similar crosstabulation of education and number of jobs previously held (jobsonresume) with black. Note that these two variables have 5 and 7 possible values, respectively. Use the the tab command with the chi-squared option to test if education is independent of the black variable, and then do the same for jobsonresume and black. After conducting these analyses, please report the following in the comments of your do-file: 2 ECON 672-PS 1 3 1. The proportion of resumes with black sounding names that have some college or more education (that is, the "some college" category as well as the college degree and more category") ) il. The proportion of resumes with white-sounding names that have some college or more education ill. The Pearson chi-squared statistic iv. The p-value for the wall hypothesis that the the education and black are independent of each other V. The proportion of resumes with black sounding names that have 5 or more previous jobs vl. The proportion of resumes with white-sounding names that have 5 or more previous jolis vil. The Pearson chi2 statistic vill. The p-value for the null hypothesis that jobsonresume and black are independent of each other ix. Do the two attributes appear to be balanced across the two groups of resumes? Why or why not? (c) Why do we care about whether these variables on resume characteristies look similar acroes the two groups of resumes! (d) The outcome variable of interest in this study is "call", which indicates whether or not a particular resume generated a call back for a job interview. Using tabulations and t-tests, Do you find differences in call-back rates by race group? Run a regression of call on black along with the other covariates you have analyzed above and verify that the effect of black is consistent with what you found through the t-test 4. Randomized Evaluation - Estimating Racial Discrimination in the Labor Market (STATA exercise, 33 points). Suppose you are advising a member of the Council of the Dis- trict of Columbia who is concerned about discriminatory hiring practices and would like to help craft an intervention that could alleviate racial disparities in labor market outcomes. To exam ine some of the potential causal effects, we will use a dataset based on a randomized experiment conducted by Marianne Bertrand and Sendhil Mullainathan, who sent 4.870 fictitious resumes out to employers in response to real job advertisements in Boston and Chicago in 2001. The resumes differed in various attributes including education and experience, and the authors assigned some resumes distinctly white sounding names and other resumes distinctly black sounding names. Dif- ferent resumes were randomly allocated to job openings. The researchers collecting these data were interested in learning whether applicants with black sounding names obtain fewer callhacks for interviews than white sounding names . Download the dataset pslandit.dta from the course website. (a) The dataset includes two indicator variables for female and computer skills. Using the tab command or the tabsum command, separately tabulate these two variables by black display the percentages of each race group that is female, and the percentages of each race group that has computer skills. Perform t-tests of the equality of means of each of the two attributes, by race group. After performing these analyses, please report the following in the comments of your do-file separately for female and for computer skills: 1. The means of female for resumes with white sounding names and for resumes with black sounding names il. The difference in the means between the two groups of resumes ill. The t-statistic for this difference iv. The p-value for the null hypothesis that the two means are equal v. The means of computer skills for resumes with white sounding names and for resumes with black sounding names vl. The difference in the means between the two groups of resumes vil. The t-statistic for this difference vill. The p-value for the null hypothesis that the two means are equal lx. Do gender and computer skills appear to be balanced across resumes with black sounding names and resumes with white sounding names? Why or why not? (b) Do a similar crosstabulation of education and number of jobs previously held (jobsonresume) with black. Note that these two variables have 5 and 7 possible values, respectively. Use the the tab command with the chi-squared option to test if education is independent of the black variable, and then do the same for jobsonresume and black. After conducting these analyses, please report the following in the comments of your do-file: 2 ECON 672-PS 1 3 1. The proportion of resumes with black sounding names that have some college or more education (that is, the "some college" category as well as the college degree and more category") ) il. The proportion of resumes with white-sounding names that have some college or more education ill. The Pearson chi-squared statistic iv. The p-value for the wall hypothesis that the the education and black are independent of each other V. The proportion of resumes with black sounding names that have 5 or more previous jobs vl. The proportion of resumes with white-sounding names that have 5 or more previous jolis vil. The Pearson chi2 statistic vill. The p-value for the null hypothesis that jobsonresume and black are independent of each other ix. Do the two attributes appear to be balanced across the two groups of resumes? Why or why not? (c) Why do we care about whether these variables on resume characteristies look similar acroes the two groups of resumes! (d) The outcome variable of interest in this study is "call", which indicates whether or not a particular resume generated a call back for a job interview. Using tabulations and t-tests, Do you find differences in call-back rates by race group? Run a regression of call on black along with the other covariates you have analyzed above and verify that the effect of black is consistent with what you found through the t-test
Step by Step Solution
There are 3 Steps involved in it
1 Expert Approved Answer
Step: 1 Unlock

Question Has Been Solved by an Expert!
Get step-by-step solutions from verified subject matter experts
Step: 2 Unlock
Step: 3 Unlock