

Question: Need help with these Chi Problems please ! Suppose a company surveyed the work preferences and attitudes of 1,006 working adults spread over three generations:
Need help with these Chi Problems please !
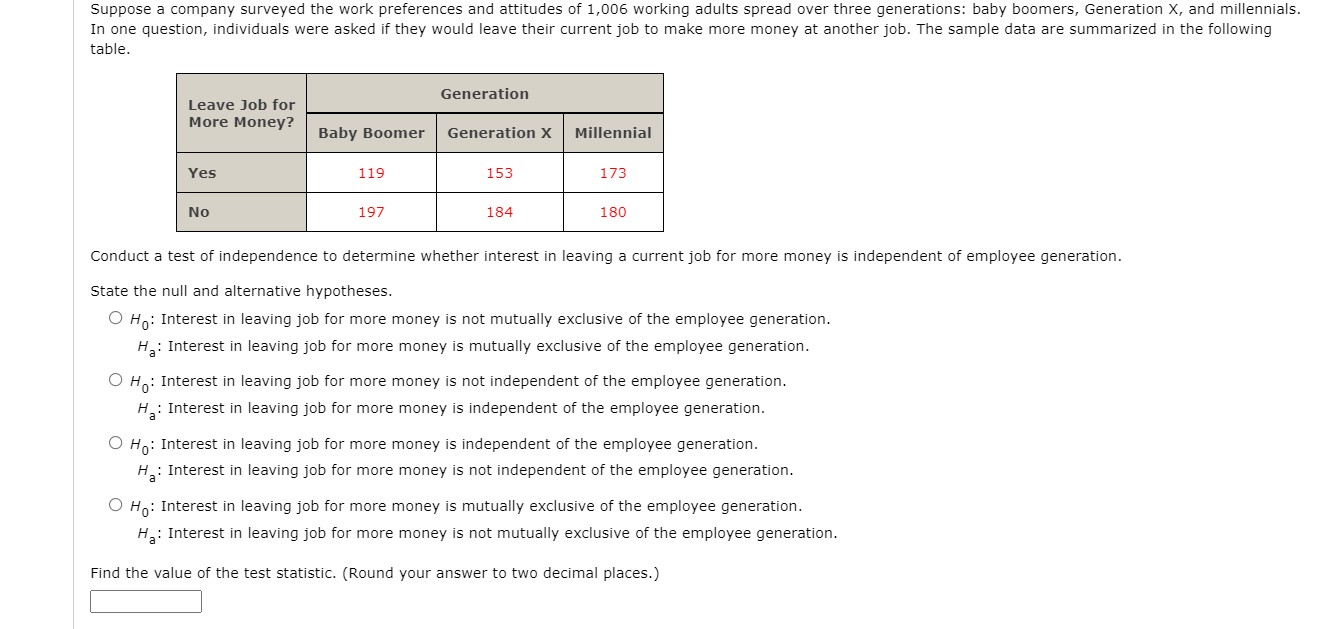
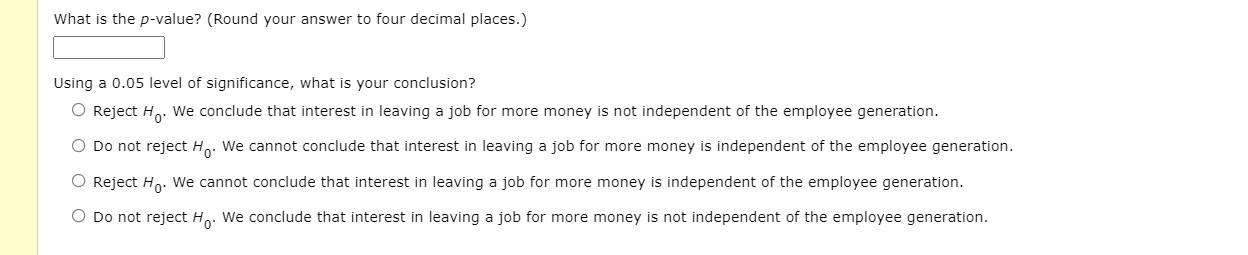
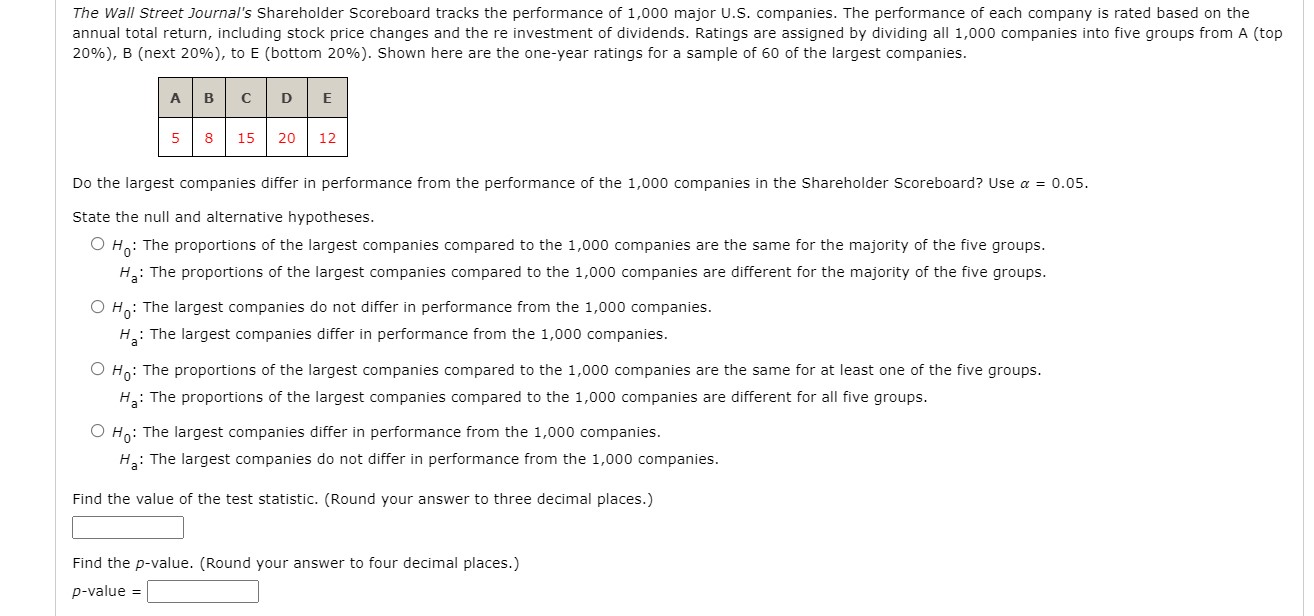
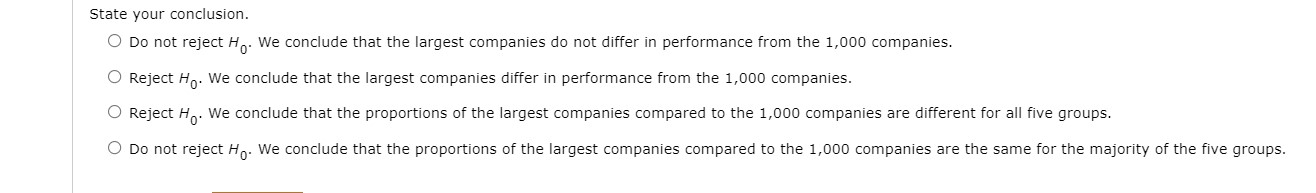
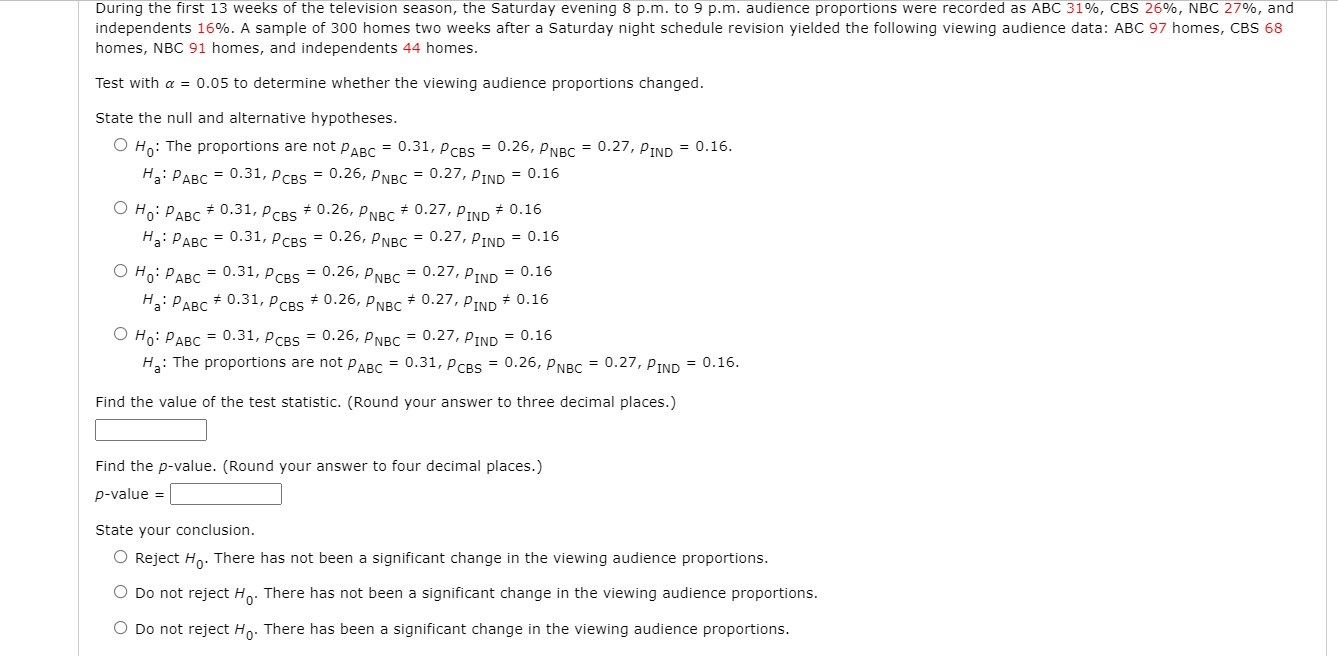
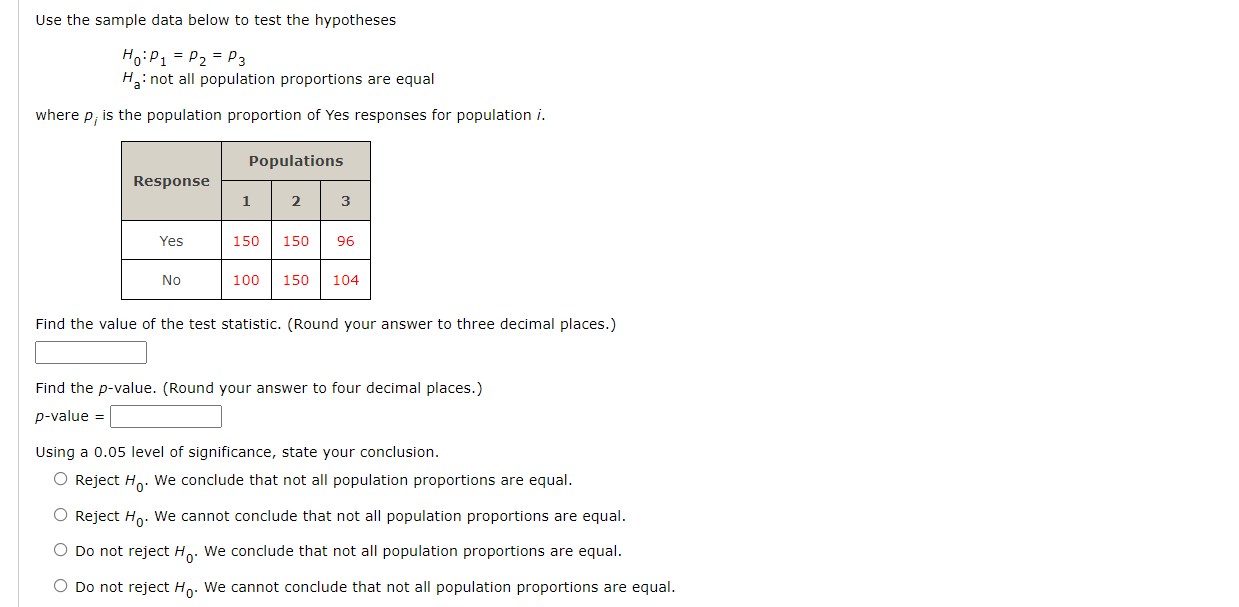
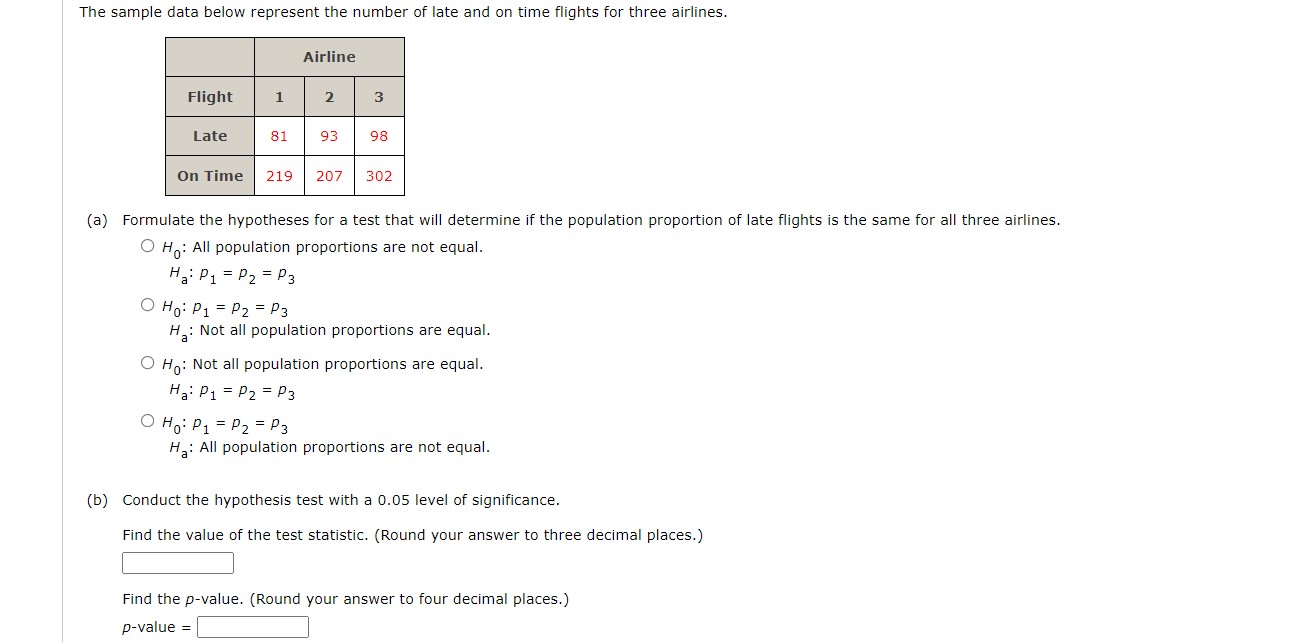
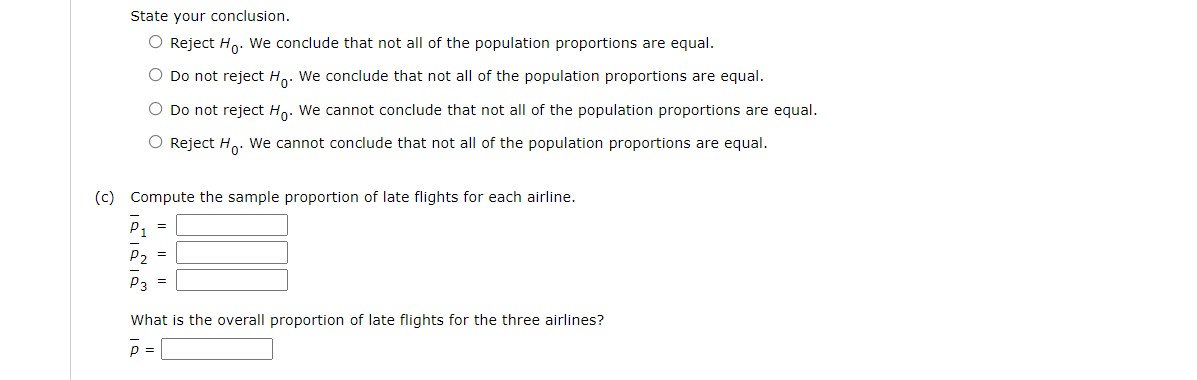
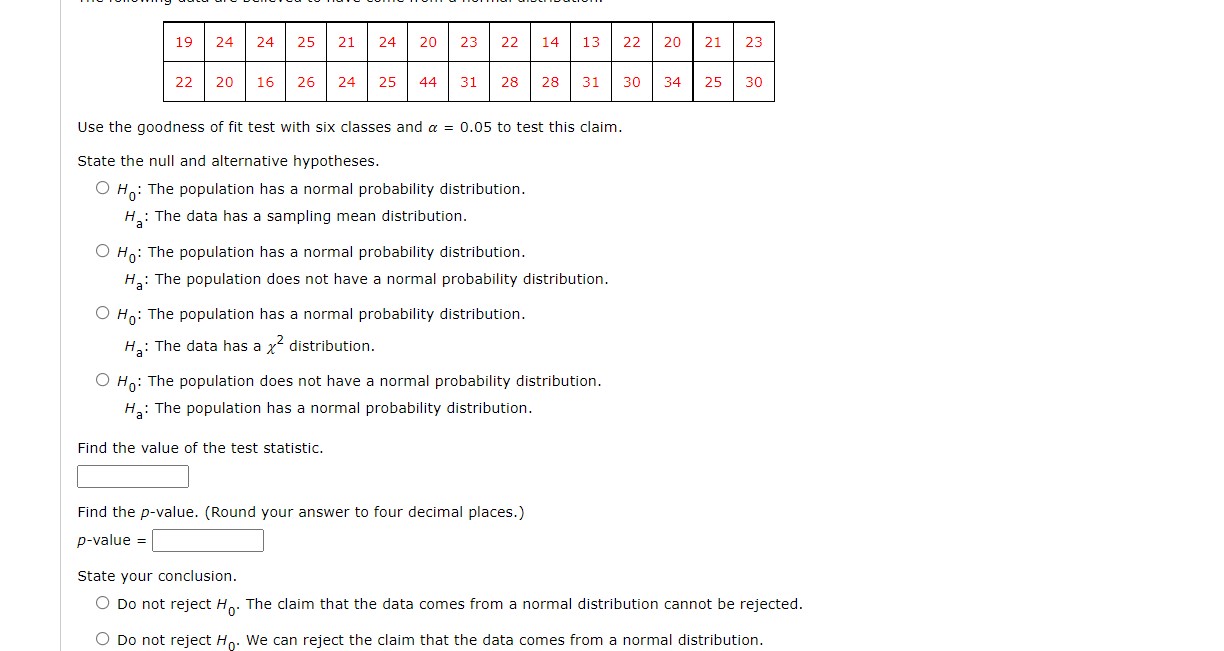
Suppose a company surveyed the work preferences and attitudes of 1,006 working adults spread over three generations: baby boomers, Generation X, and millennials. In one question. individuals were asked if they would leave their current job to make more money at anotherjob. The sample data are summarized in the following table. Conduct a test of independence to determine whether interest in leaving a current job for more money is independent of employee generation. State the null and alternative hypotheses. 0 Ho: Interest in leaving job for more money is not mutually exclusive of the employee generation. Ha: Interest in leaving job for more money is mutually exclusive of the employee generation. 0 H0: Interest in leaving job for more money is not independent of the employee generation. Ha: Interest in leaving job for more money is independent of the employee generation. 0 Ho: Interest in leaving job for more money is independent of the employee generation. Ha: Interest in leaving job for more money is not independent of the employee generation. 0 Ho: Interest in leaving job for more money is mutually exclusive of the employee generation. Ha: Interest in leaving job for more money is not mutually exclusive of the employee generation. Find the value of the test statistic. (Round your answer to two decimal places.) :I What is the pvalue? (Round your answer to four decimal places.) E Using a 0.05 level of signicance, what is your conclusion? 0 Reject Ho. We conclude that interest in leaving a job for more money is not independent of the employee generation. 0 Do not reject H0. We cannot conclude that interest in leaving a job for more money is independent of the employee generation. 0 Reject \"0' We cannot conclude that interest in leaving a job for more money is independent of the employee generation. 0 Do not reject H0. We conclude that interest in leaving a job for more money is not independent of the employee generation. The Wall Street Journal's Shareholder Scoreboard tracks the performance of 1,000 major U.S. companies. The performance of each company is rated based on the annual total return, including stock price changes and the re investment of dividends. Ratings are assigned by dividing all 1,000 companies into five groups from A (top 20%), B (next 20%), to E (bottom 20%). Shown here are the one-year ratings for a sample of 60 of the largest companies. A 1; c 11': 5 3 15 20 ' 12 Do the largest companies differ in performance from the performance of the 1,000 companies in the Shareholder Scoreboard? Use a = 0.05. State the null and alternative hypotheses. O Ho: The proportions of the largest companies compared to the 1,000 companies are the same for the majority of the five groups. Ha: The proportions of the largest companies compared to the 1,000 companies are different for the majority of the five groups. 0 HO: The largest companies do not differ in performance from the 1,000 companies. H3: The largest companies differ in performance from the 1,000 companies. 0 H0: The proportions of the largest companies compared to the 1,000 companies are the same for at least one of the ve groups. Ha: The proportions of the largest companies compared to the 1,000 companies are different for all ve groups. 0 H0: The largest companies differ in performance from the 1,000 companies. Ha: The largest companies do not differ in performance from the 1,000 companies. Find the value of the test statistic. (Round your answer to three decimal places.) E Find the pvalue. (Round your answer to four decimal places.) State your conclusion. 0 Do not reject Ho' We conclude that the largest companies do not differ in performance from the 1,000 companies. 0 Reject H0. We conclude that the largest companies differ in performance from the 1,000 companies. 0 Reject H0. We conclude that the proportions of the largest companies compared to the 1,000 companies are different for all ve groups. 0 Do not reject Ho- We conclude that the proportions of the largest companies compared to the 1,000 companies are the same for the majority of the five groups. During the first 13 weeks of the television season, the Saturday evening 8 p.m. to 9 p.m. audience proportions were recorded as ABC 31%, CBS 26%, NBC 27%, and independents 16%. A sample of 300 homes two weeks after a Saturday night schedule revision yielded the following viewing audience data: ABC 97 homes, CBS 68 homes, NBC 91 homes, and independents 44 homes. Test with a = 0.05 to determine whether the viewing audience proportions changed. State the null and alternative hypotheses. O Ho: The proportions are not PABC = 0.31, PCBS = 0.26, PNBC = 0.27, PIND = 0.16. Ha: PABC = 0.31, PCBS = 0.26, PNBC = 0.27, PIND = 0.16 O Ho: PABC # 0.31, PCBS # 0.26, PNBC # 0.27, PIND # 0.16 Ha: PABC = 0.31, PCBS = 0.26, PNBC = 0.27, PIND = 0.16 O Ho: PABC = 0.31, PCBS = 0.26, PNBC = 0.27, PIND = 0.16 Hai PABC # 0.31, PCBS # 0.26, PNBC # 0.27, PIND * 0.16 O Ho: PABC = 0.31, PCBS = 0.26, PNBC = 0.27, PIND = 0.16 Ha: The proportions are not PABC = 0.31, PCBS = 0.26, PNBC = 0.27, PIND = 0.16. Find the value of the test statistic. (Round your answer to three decimal places.) Find the p-value. (Round your answer to four decimal places.) p-value = State your conclusion. O Reject Ho. There has not been a significant change in the viewing audience proportions. O Do not reject Ho. There has not been a significant change in the viewing audience proportions. O Do not reject Ho. There has been a significant change in the viewing audience proportions.Use the sample data below to test the hypotheses \"03-91 = .02 = p3 Hal not all population proportions are equal where pr. is the population proportion of Yes responses for population i. Yes 1 50 1 50 96 N0 100 150 104 Find the value of the test statistic. (Round your answer to three decimal places.) E Find the pvalue. {Round your answer to four decimal places.) Using a [1.05 level of signicance, state your conclusion. 0 Reject H0. We conclude that not all population proportions are equal. 0 Reject H0. We cannot conclude that not all population proportions are equal. 0 Do not reject H0. We conclude that not all population proportions are equal. 0 Do not reject H0. We cannot conclude that not all population proportions are equal. The sample data below represent the number of late and on time flights for three airlines. Airline Flight 1 2 3 Late 81 93 98 On Time 219 207 302 (a) Formulate the hypotheses for a test that will determine if the population proportion of late flights is the same for all three airlines. O H: All population proportions are not equal. HA: P1 = P2 = P3 O Ho: P1 = P2 = P3 H.: Not all population proportions are equal. O Ho: Not all population proportions are equal. Ha: P1 = P2 = P3 OH: P1 = P2 = P3 He: All population proportions are not equal. (b) Conduct the hypothesis test with a 0.05 level of significance. Find the value of the test statistic. (Round your answer to three decimal places.) Find the p-value. (Round your answer to four decimal places.) p-value =State your conclusion. 0 Reject H0. We conclude that not all of the population proportions are equal. 0 Do not reject H0. We conclude that not all of the population proportions are equal. 0 Do not reject H0. We cannot conclude that not all of the population proportions are equal. 0 Reject H0. We cannot conclude that not all of the population proportions are equal. (c) Compute the sample proportion of late flights for each airline. 51 = E p2 = E p3 = :I What is the overall proportion of late ights for the three airlines? 5:: 19 24 24 25 21 24 20 23 22 14 13 22 20 21 23 22 20 16 26 24 25 44 31 28 28 31 30 34 25 30 Use the goodness of fit test with six classes and a = 0.05 to test this claim. State the null and alternative hypotheses. H: The population has a normal probability distribution. H. : The data has a sampling mean distribution. O Ho: The population has a normal probability distribution. Ha: The population does not have a normal probability distribution. O Ho: The population has a normal probability distribution. Ha: The data has a x distribution. O Ho: The population does not have a normal probability distribution. Ha: The population has a normal probability distribution. Find the value of the test statistic. Find the p-value. (Round your answer to four decimal places.) p-value = State your conclusion. O Do not reject H . The claim that the data comes from a normal distribution cannot be rejected. O Do not reject Ho. We can reject the claim that the data comes from a normal distribution
Step by Step Solution
There are 3 Steps involved in it

Get step-by-step solutions from verified subject matter experts