

Question: Need help with these questions 12:27 . LTE a webassign.net What percent of undergraduate enrollment in coed colleges and universities in the United States is
Need help with these questions
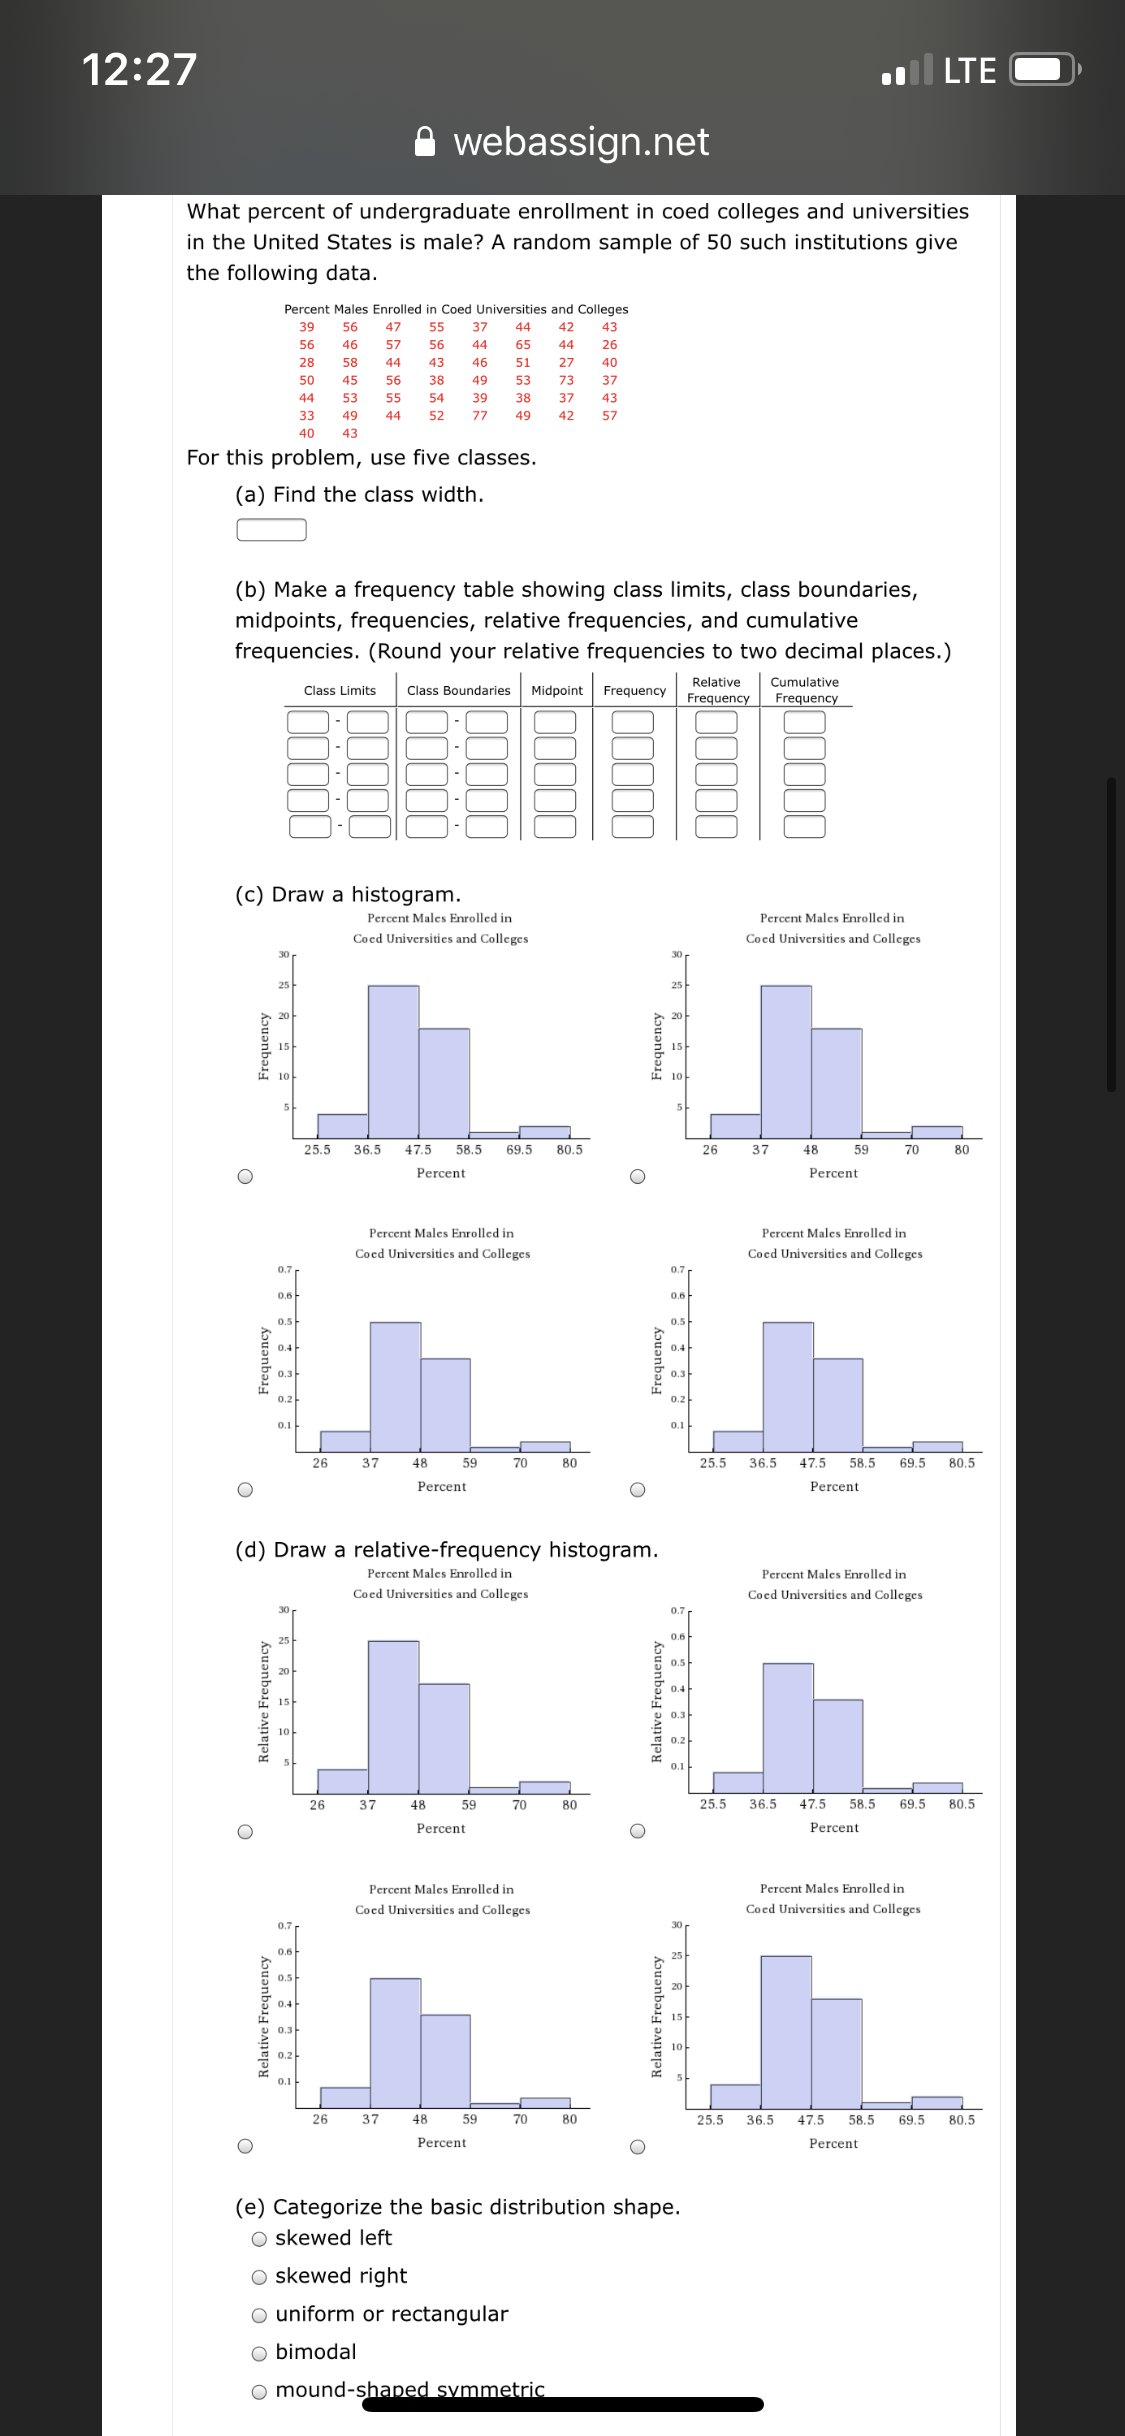
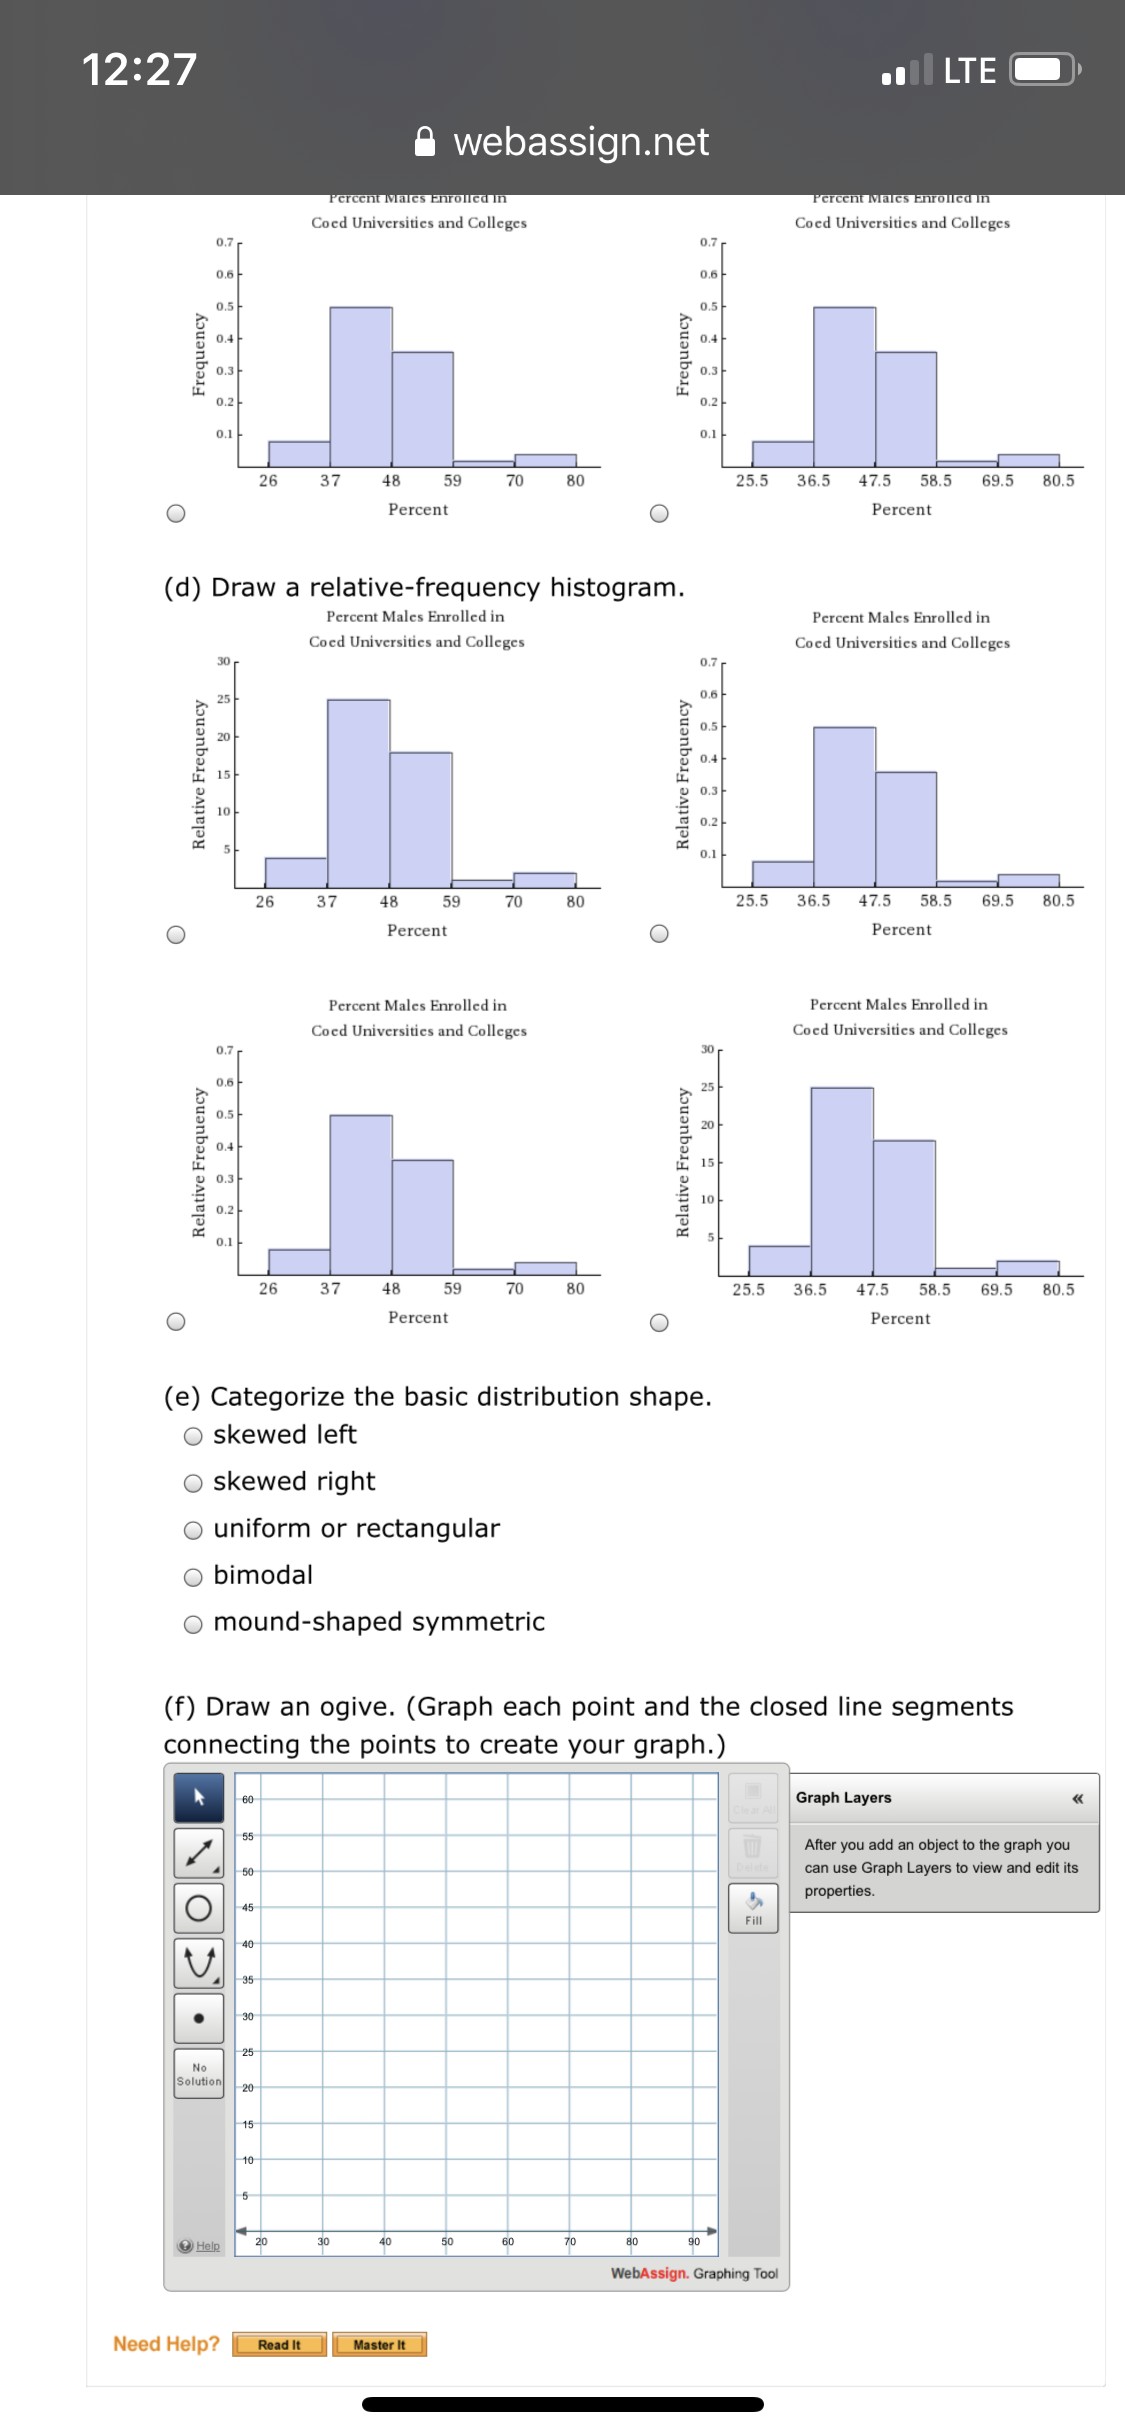
12:27 . LTE a webassign.net What percent of undergraduate enrollment in coed colleges and universities in the United States is male? A random sample of 50 such institutions give the following data Percent Males Enrolled in Coed Universities and Colleges 39 56 47 37 44 42 46 43 56 57 55 56 44 65 44 51 26 43 27 40 38 46 49 39 53 37 38 73 37 43 77 49 42 57 For this problem, use five classes. (a) Find the class width. (b) Make a frequency table showing class limits, class boundaries, midpoints, frequencies, relative frequencies, and cumulative frequencies. (Round your relative frequencies to two decimal places.) Class Limits Class Boundaries Midpoint Frequency Relative Cumulative Frequency Frequency OL UL (c) Draw a histogram. Percent Males Enrolled in Percent Males Enrolled in Coed Universities and Colleges Coed Universities and Colleges Frequency Frequency 5 25.5 36.5 47.5 58.5 69.5 80.5 26 37 48 59 70 80 O Percent Percent Percent Males Enrolled in Percent Males Enrolled in Coed Universities and Colleges Coed Universities and Colleges Frequency Frequency 0.1 26 37 48 59 70 80 25.5 47.5 58.5 69.5 80.5 Percent Percent (d) Draw a relative-frequency histogram. Percent Males Enrolled in Percent Males Enrolled in Coed Universities and Colleges Coed Universities and Colleges Relative Frequency Relative Frequency 26 37 48 59 70 80 25.5 36.5 47.5 58.5 69.5 80.5 Percent O Percent Percent Males Enrolled in Percent Males Enrolled in Coed Universities and Colleges Coed Universities and Colleges Relative Frequency Relative Frequency 26 37 48 59 70 80 25.5 36.5 47.5 5 69.5 80.5 O Percent Percent (e) Categorize the basic distribution shape. O skewed left O skewed right uniform or rectangular O bimodal O mound-shaped symmetric12:27 . LTE a webassign.net Percent Males Enrolled In Percent Males Enrolled In Coed Universities and Colleges Coed Universities and Colleges 0.7 Frequency Frequency 0.5 0.4 0.3 0.2 0.1 26 37 48 59 70 80 25.5 36.5 47.5 58.5 69.5 80.5 Percent O Percent (d) Draw a relative-frequency histogram. Percent Males Enrolled in Percent Males Enrolled in Coed Universities and Colleges Coed Universities and Colleges 30 0.7 Relative Frequency 25 6 5 8 Relative Frequency 0.5 0.5 0.3 0.2 0.1 26 37 48 59 70 80 25.5 36.5 47.5 58.5 69.5 80.5 O Percent O Percent Percent Males Enrolled in Percent Males Enrolled in Coed Universities and Colleges Coed Universities and Colleges 30 Relative Frequency Relative Frequency 25 26 37 48 59 70 80 25.5 36.5 47.5 58.5 69.5 80.5 O Percent O Percent (e) Categorize the basic distribution shape. O skewed left O skewed right O uniform or rectangular O bimodal O mound-shaped symmetric (f) Draw an ogive. (Graph each point and the closed line segments connecting the points to create your graph.) so Graph Layers After you add an object to the graph you can use Graph Layers to view and edit its O properties. Fill C -35- . No 8 8 Solution -20 15 -10 Help 20 30 40 50 60 70 80 90 WebAssign. Graphing Tool Need Help? Read It Master It
Step by Step Solution
There are 3 Steps involved in it

Get step-by-step solutions from verified subject matter experts