

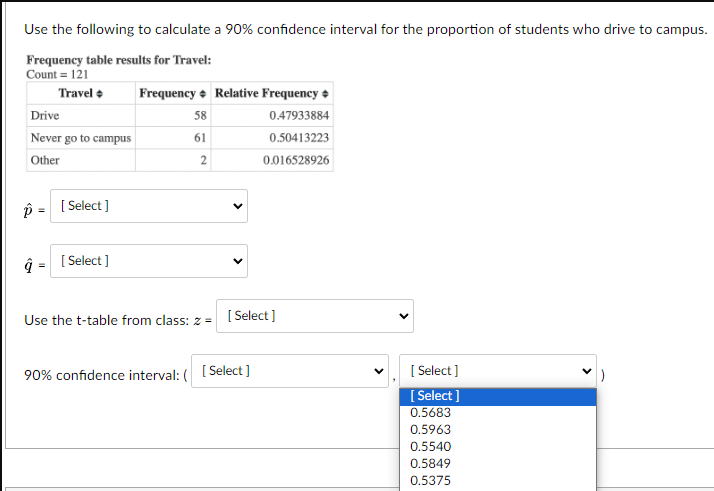
Question: Need help with these questions. I don't know or have a refence. Use the following to calculate a 90% confidence interval for the proportion of
Need help with these questions. I don't know or have a refence.
![Select ] V [ Select ] 0.4793 0.0165 0.5041 0.9000Use the following](https://dsd5zvtm8ll6.cloudfront.net/si.experts.images/questions/2024/10/671b99708823f_000671b99704628d.jpg)
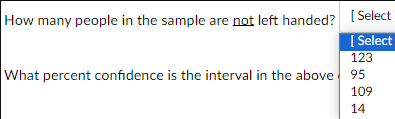
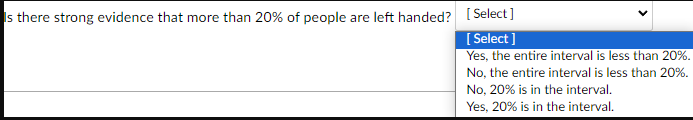
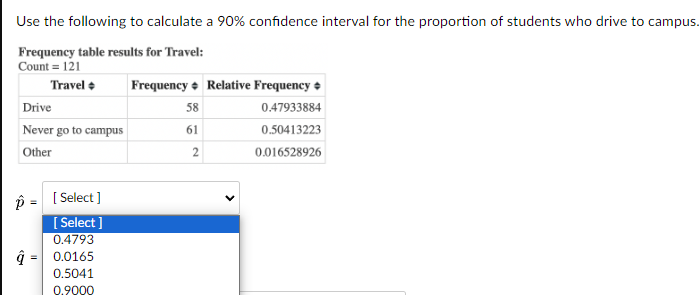
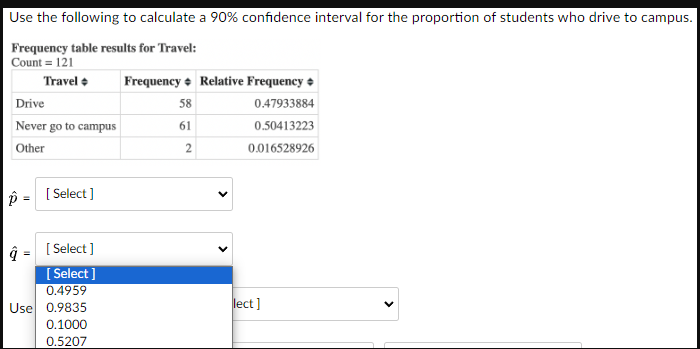
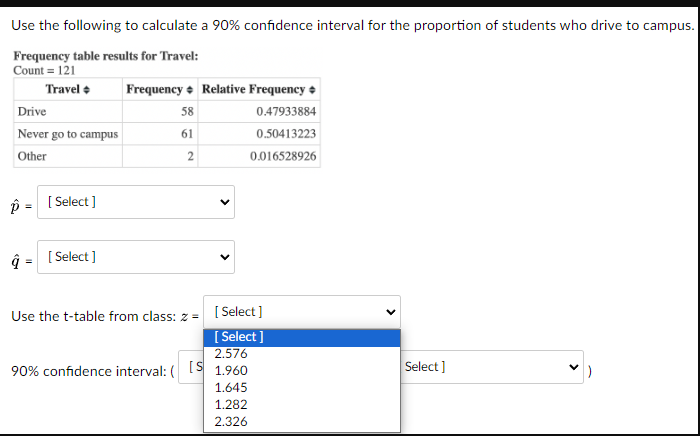
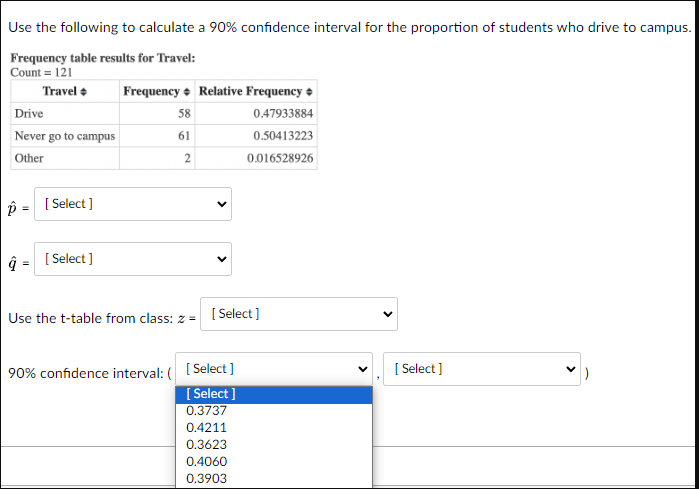
Use the following to calculate a 90% confidence interval for the proportion of students who drive to campus Frequency table results for Travel: Count = 121 Travel * Frequency . Relative Frequency + Drive 58 0.47933884 Never go to campus 61 0.50413223 Other 2 0.016528926 p : [ Select ] V [ Select ] 0.4793 0.0165 0.5041 0.9000Use the following to calculate a 90% confidence interval for the proportion of students who drive to campus. Frequency table results for Travel: Count = 121 Travel * Frequency . Relative Frequency + Drive 58 0.47933884 Never go to campus 61 0.50413223 Other 2 0.016528926 p = [ Select ] V [ Select ] v [ Select ] 0.4959 Use 0.9835 lect ] V 0.1000 0.5207Use the following to calculate a 90% confidence interval for the proportion of students who drive to campus. Frequency table results for Travel: Count = 121 Travel * Frequency . Relative Frequency * Drive 58 0.47933884 Never go to campus 61 0.50413223 Other 2 0.016528926 D = [ Select ] [ Select ] Use the t-table from class: z = [ Select ] [ Select ] 2.576 90% confidence interval: ( [ S 1.960 Select ] 1.645 1.282 2.326Use the following to calculate a 90% confidence interval for the proportion of students who drive to campus. Frequency table results for Travel: Count = 121 Travel Frequency . Relative Frequency + Drive 58 0.47933884 Never go to campus 61 0.50413223 Other 2 0.016528926 [ Select ] q = [ Select ] Use the t-table from class: z = [ Select ] V 90% confidence interval: ( [ Select ] V [ Select ] [ Select ] 0.3737 0.4211 0.3623 0.4060 0.3903Use the following to calculate a 90% confidence interval for the proportion of students who drive to campus. Frequency table results for Travel: Count = 121 Travel Frequency Relative Frequency Drive 38 047933884 MNever go to campus 61 0.50413223 Other 2 D016528926 ' - [Select] L @ = [Select] w Use the t-table from class: z = | Select] 90% confidence interval: ([ Select] [ Select ] 0.5683 0.5963 0.5540 0.5849 0.5375 One sample proportion confidence interval: Outcomes in : Hand Success : Left p : Proportion of successes Method: Standard-Wald 95% confidence interval resulis: Variable Count Total Sample Prop. 5id. Err. L. Limit U, Limit Hand 14 123 011382114 0028636478 0057694673 0.1699476 [ Select ] [ Select ] Hand ow many people in the sample 3 Left Right hat variable are we examining? How many people in the sample are not left handed? [ Select [ Select 123 What percent confidence is the interval in the above 95 109 14[ Select ] s there strong evidence that more than 20% of people are left handed? Yes, the entire interval is less than 20%. Mo, the entire interval is less than 20%. Mo, 20% is in the interval. Yes, 200 is in the interval
Step by Step Solution
There are 3 Steps involved in it

Get step-by-step solutions from verified subject matter experts