

Question: Need help with this assignment appreciate you Suppose the Aggregate Demand and Supply schedules for a hypothetical economy are as shown below: Amount of Real

Need help with this assignment appreciate you
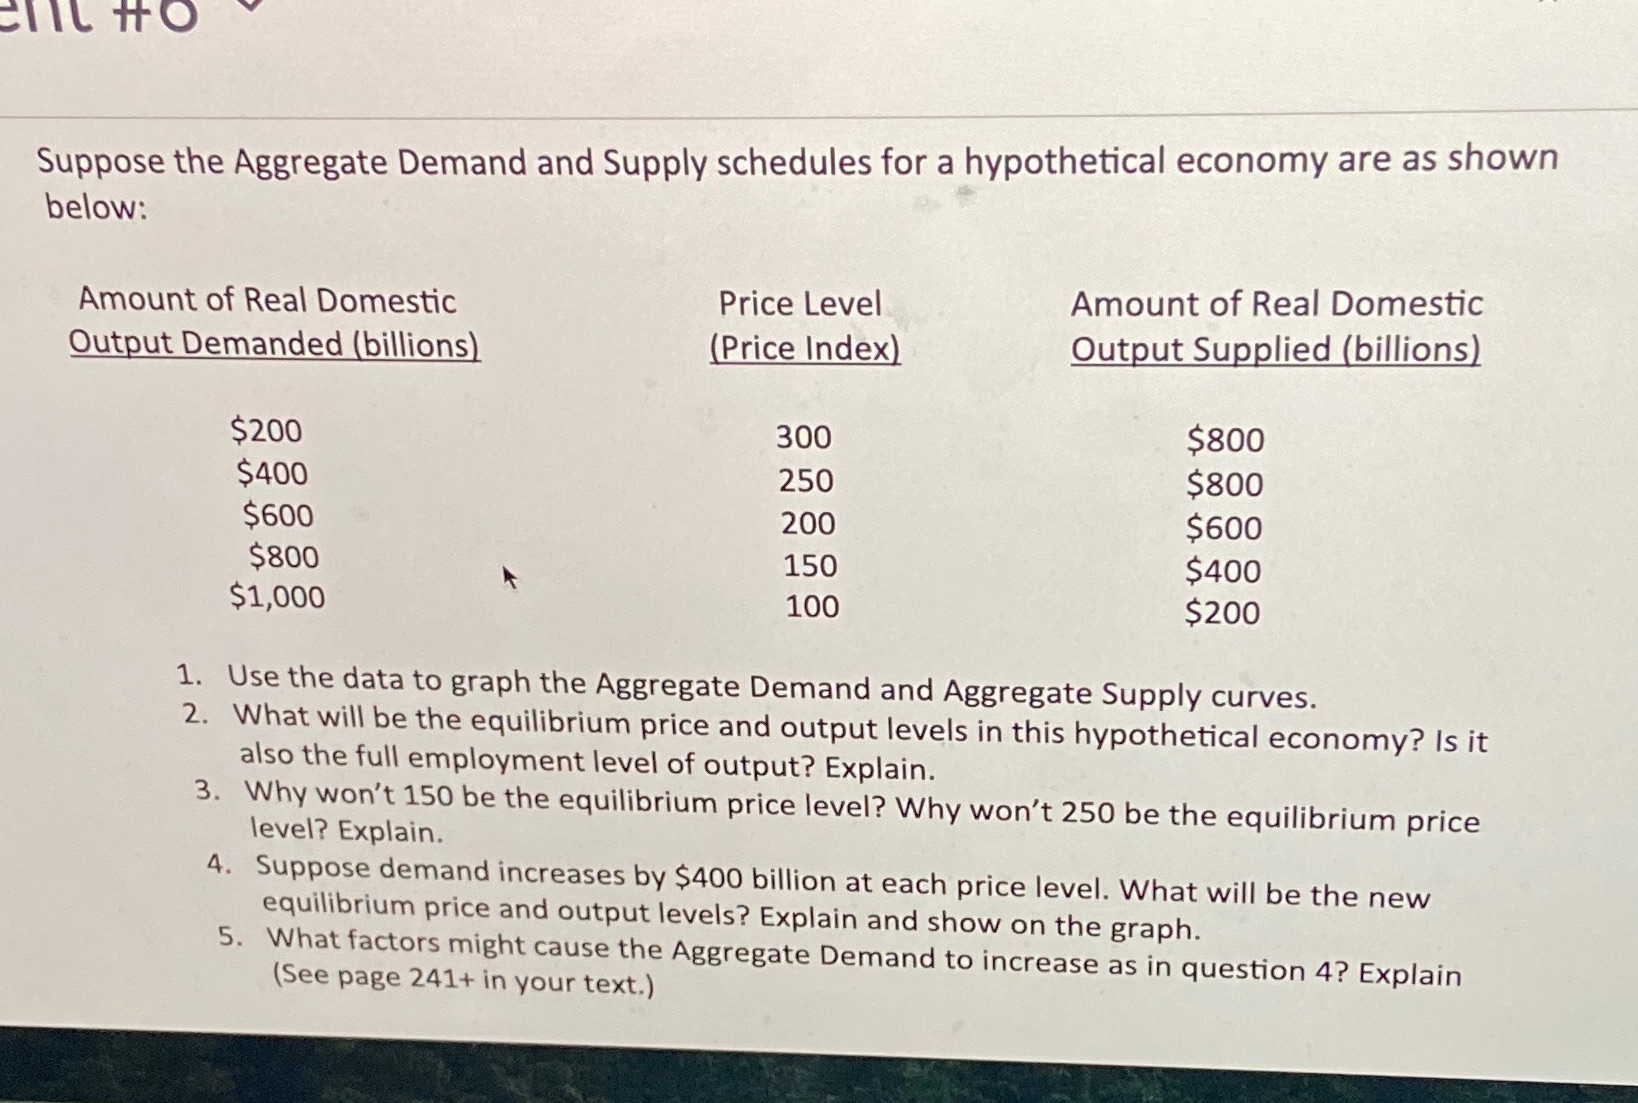
Suppose the Aggregate Demand and Supply schedules for a hypothetical economy are as shown below: Amount of Real Domestic Price Level Amount of Real Domestic Output Demanded (billions) (Price Index) Output Supplied (billions) $200 300 $800 $400 250 $800 $600 200 $600 $800 150 $400 $1,000 100 $200 1. Use the data to graph the Aggregate Demand and Aggregate Supply curves. 2. What will be the equilibrium price and output levels in this hypothetical economy? Is it also the full employment level of output? Explain. 3. Why won't 150 be the equilibrium price level? Why won't 250 be the equilibrium price level? Explain. 4. Suppose demand increases by $400 billion at each price level. What will be the new equilibrium price and output levels? Explain and show on the graph. 5. What factors might cause the Aggregate Demand to increase as in question 4? Explain (See page 241+ in your text.)
Step by Step Solution
There are 3 Steps involved in it

Get step-by-step solutions from verified subject matter experts