

Question: Need help with this been at I'm on it for hours please when you solve please explain so I can understand it nalyzing graphs of
Need help with this been at I'm on it for hours please when you solve please explain so I can understand it
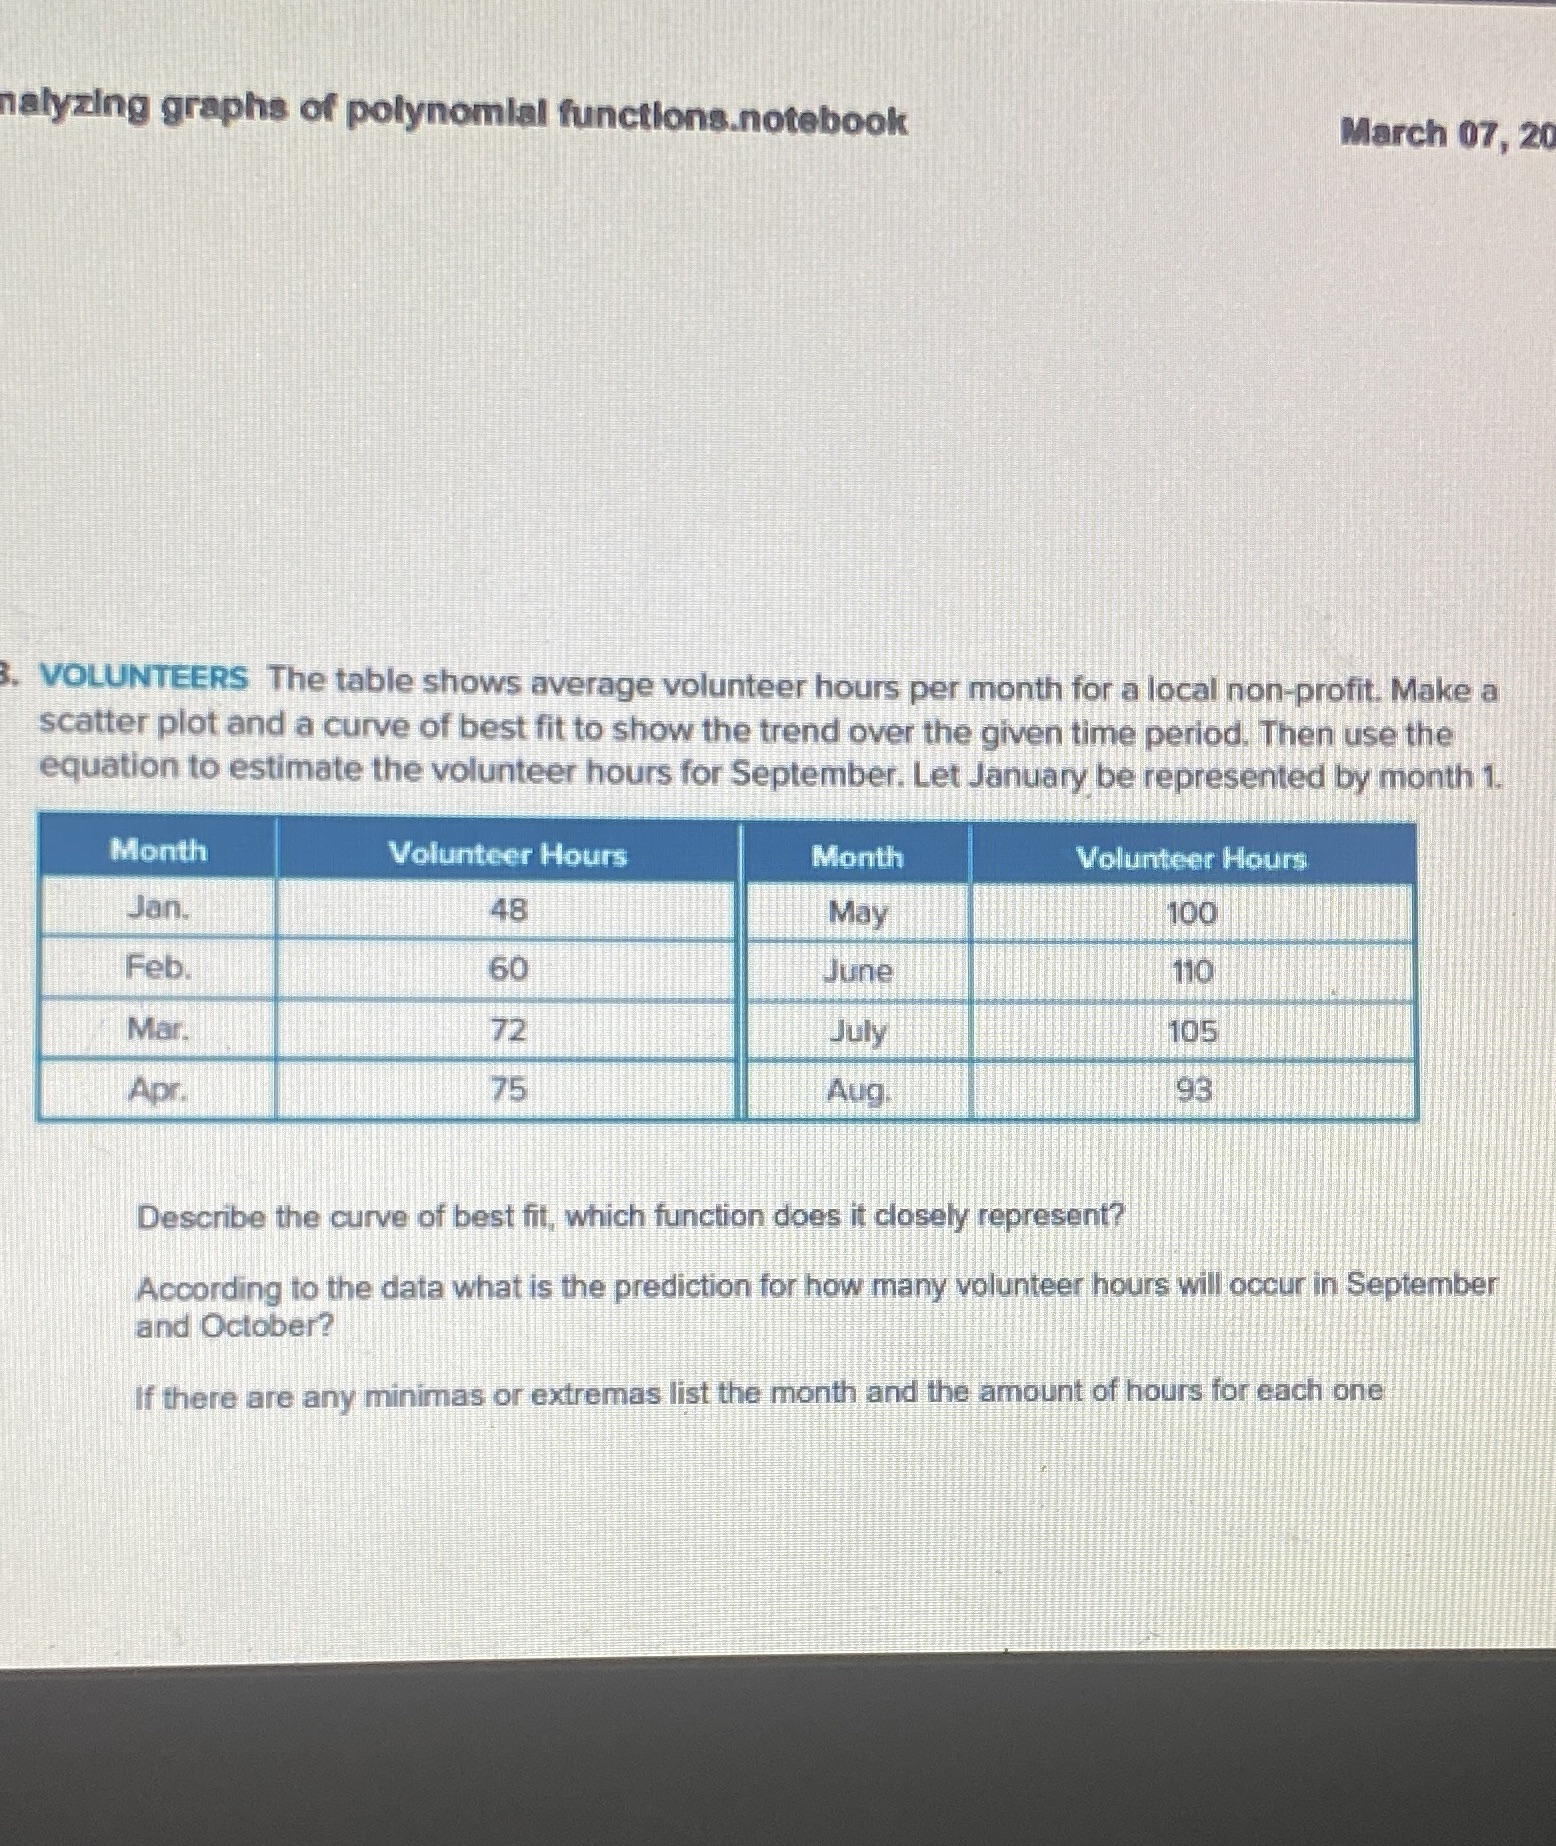
nalyzing graphs of polynomial functions.notebook March 07, 20 VOLUNTEERS The table shows average volunteer hours per month for a local non-profit. Make a scatter plot and a curve of best fit to show the trend over the given time period. Then use the equation to estimate the volunteer hours for September. Let January be represented by month 1. Month Volunteer Hours Month Volunteer Hours Jan. 48 May 100 Feb 60 June 110 Mar. 72 July 105 Apr. 75 Aug 93 Describe the curve of best fit, which function does it closely represent? According to the data what is the prediction for how many volunteer hours will occur in September and October? If there are any minimas or extremas list the month and the amount of hours for each one
Step by Step Solution
There are 3 Steps involved in it

Get step-by-step solutions from verified subject matter experts