

Question: need help with this Examine the following plot and choose the answer that best suits the relationship. 240- 220 200 O 180- Cell phones (per
need help with this
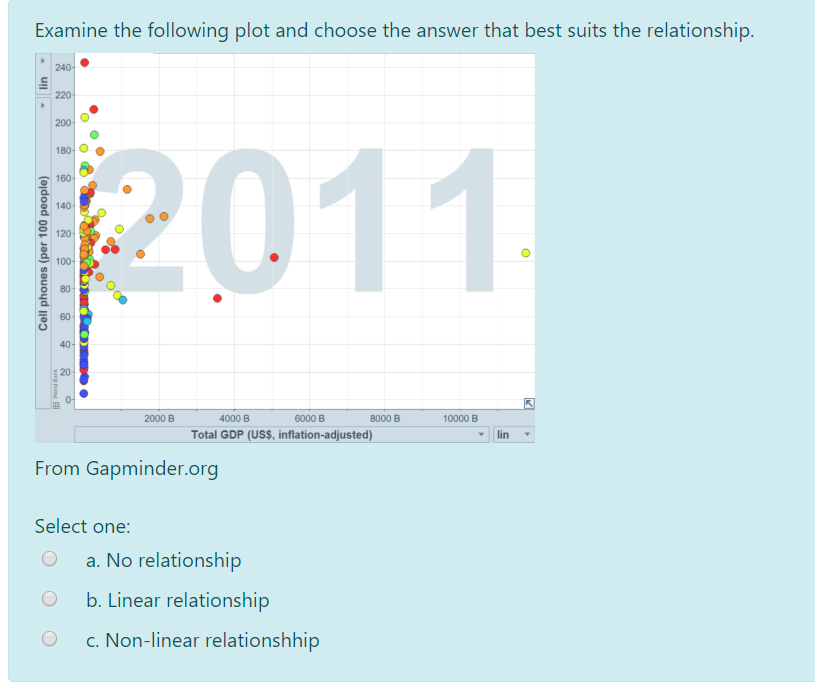
Examine the following plot and choose the answer that best suits the relationship. 240- 220 200 O 180- Cell phones (per 100 people) 160 140- 120 100- BO- 11 60 40 Ff World Bank 2000 B 4000 B 6000 B BOO0 B 10000 B Total GDP (US$, inflation-adjusted) lin From Gapminder.org Select one: O a. No relationship O b. Linear relationship O c. Non-linear relationship
Step by Step Solution
There are 3 Steps involved in it
1 Expert Approved Answer
Step: 1 Unlock

Question Has Been Solved by an Expert!
Get step-by-step solutions from verified subject matter experts
Step: 2 Unlock
Step: 3 Unlock