

Question: Need help with this one, it's hard, and I don't understand. The distribution of the hours/ week worked for pay (in a typical week} among


Need help with this one, it's hard, and I don't understand.
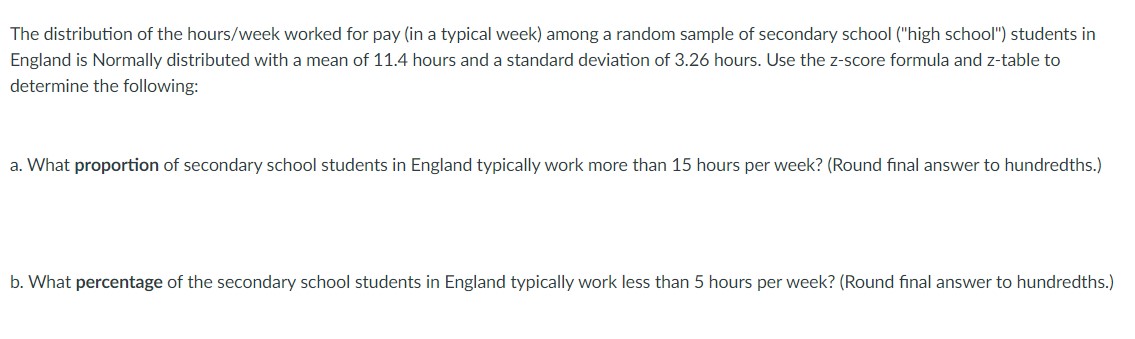
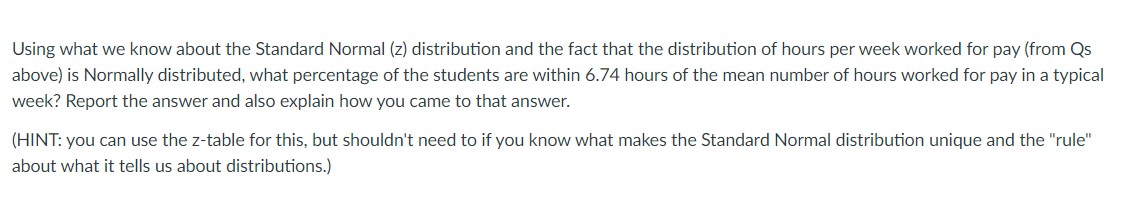


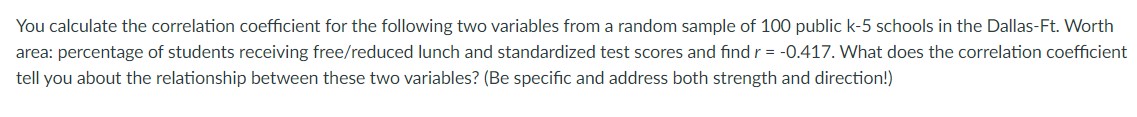
The distribution of the hours/ week worked for pay (in a typical week} among a random sample of secondary school ("high school") students in England is Normally distributed with a mean of 11.4 hours and a standard deviation of 3.26 hours. Use the zscore formula and ztable to determine the following: a. What proportion of secondary school students in England typically work more than 15 hours per week? (Round nal answer to hundredths.) b. What percentage of the secondary school students in England typically work less than 5 hours per week? (Round nal answer to hundredths.) Using what we know about the Standard Normal [2) distribution and the fact that the distribution of hours per week worked for pay (from Qs above) is Normally distributed, what percentage of the students are within 6.74 hours of the mean number of hours worked for pay in a typical week? Report the answer and also explain how you came to that answer. (HINT: you can use the z-table for this, but shouldn't need to if you know what makes the Standard Normal distribution unique and the "rule" about what it tells us about distributions.) You calculate the correlation coefficient for the following two variables from a random sample of 100 public k-5 schools in the Dallas-Ft. Worth area: percentage of students receiving free/reduced lunch and standardized test scores and find r = -0.417. What does the correlation coefficient tell you about the relationship between these two variables? (Be specific and address both strength and direction!)Looking at the same data set, you examine the descriptive statistics for the mean bus ride distance (one way) for the students at the 100 k-5 public schools sampled. You nd a sample mean of 4.83 miles and a sample standard deviation of 2.59 miles. Construct a 95% Cl around this sample mean. Interpret the condence interval found above using the standard onesentence interpretation
Step by Step Solution
There are 3 Steps involved in it

Get step-by-step solutions from verified subject matter experts