

Question: need help with this, please show step by step working and also don't write in cursive, answer must be legible Software: A researcher interested in
need help with this, please show step by step working and also don't write in cursive, answer must be legible
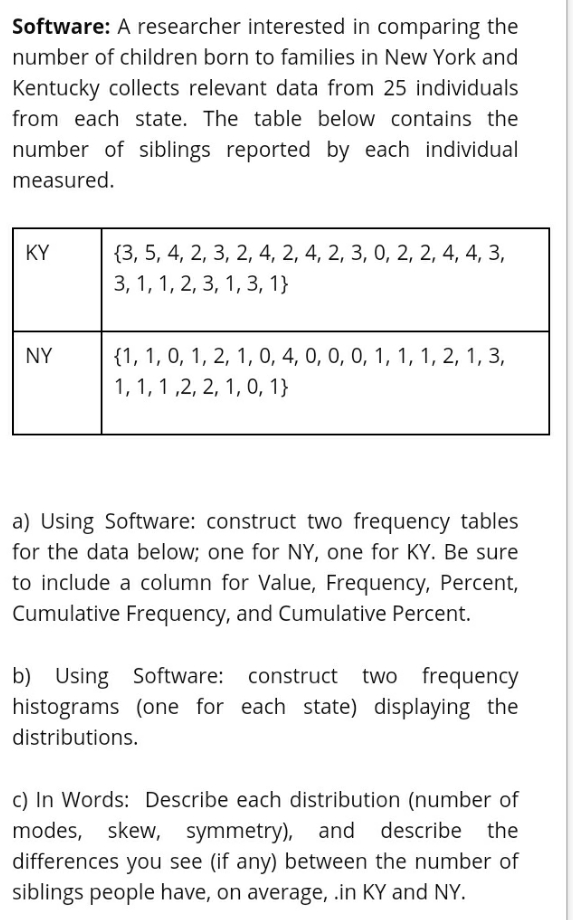
Software: A researcher interested in comparing the number of children born to families in New York and Kentucky collects relevant data from 25 Individuals from each state. The table below contains the number of siblings reported by each individual measured. {3. 5. 4. 2. 3. 2. 4. 2, 4. 2. 3. U. 2. 2. 4. 4. 3. 3, 1,1,2,3,1,3, 1} {1l1f0l1f211l 0141' DI 0! DI1I1J1I 2l1l 3! 1,1,1,2,2,1,0,1} a) Using Software: construct two frequency tables for the data below: one for NY. one for KY. Be sure to include a column for Value. Frequency, Percent, Cumulative Frequency, and Cumulative Percent. b) Using Software: construct two frequencyF histograms (one for each state) displaying the distributions. c) In Words: Describe each distribution (number of modes, skew, symmetry), and describe the differences you see (if any) between the number of siblings people have. on average. .in KY and NY
Step by Step Solution
There are 3 Steps involved in it

Get step-by-step solutions from verified subject matter experts