

Question: Need help with this problem- can someone please explain to me? I.) 7 The following frequency polygon shows the number of US. deaths by legal
Need help with this problem- can someone please explain to me?
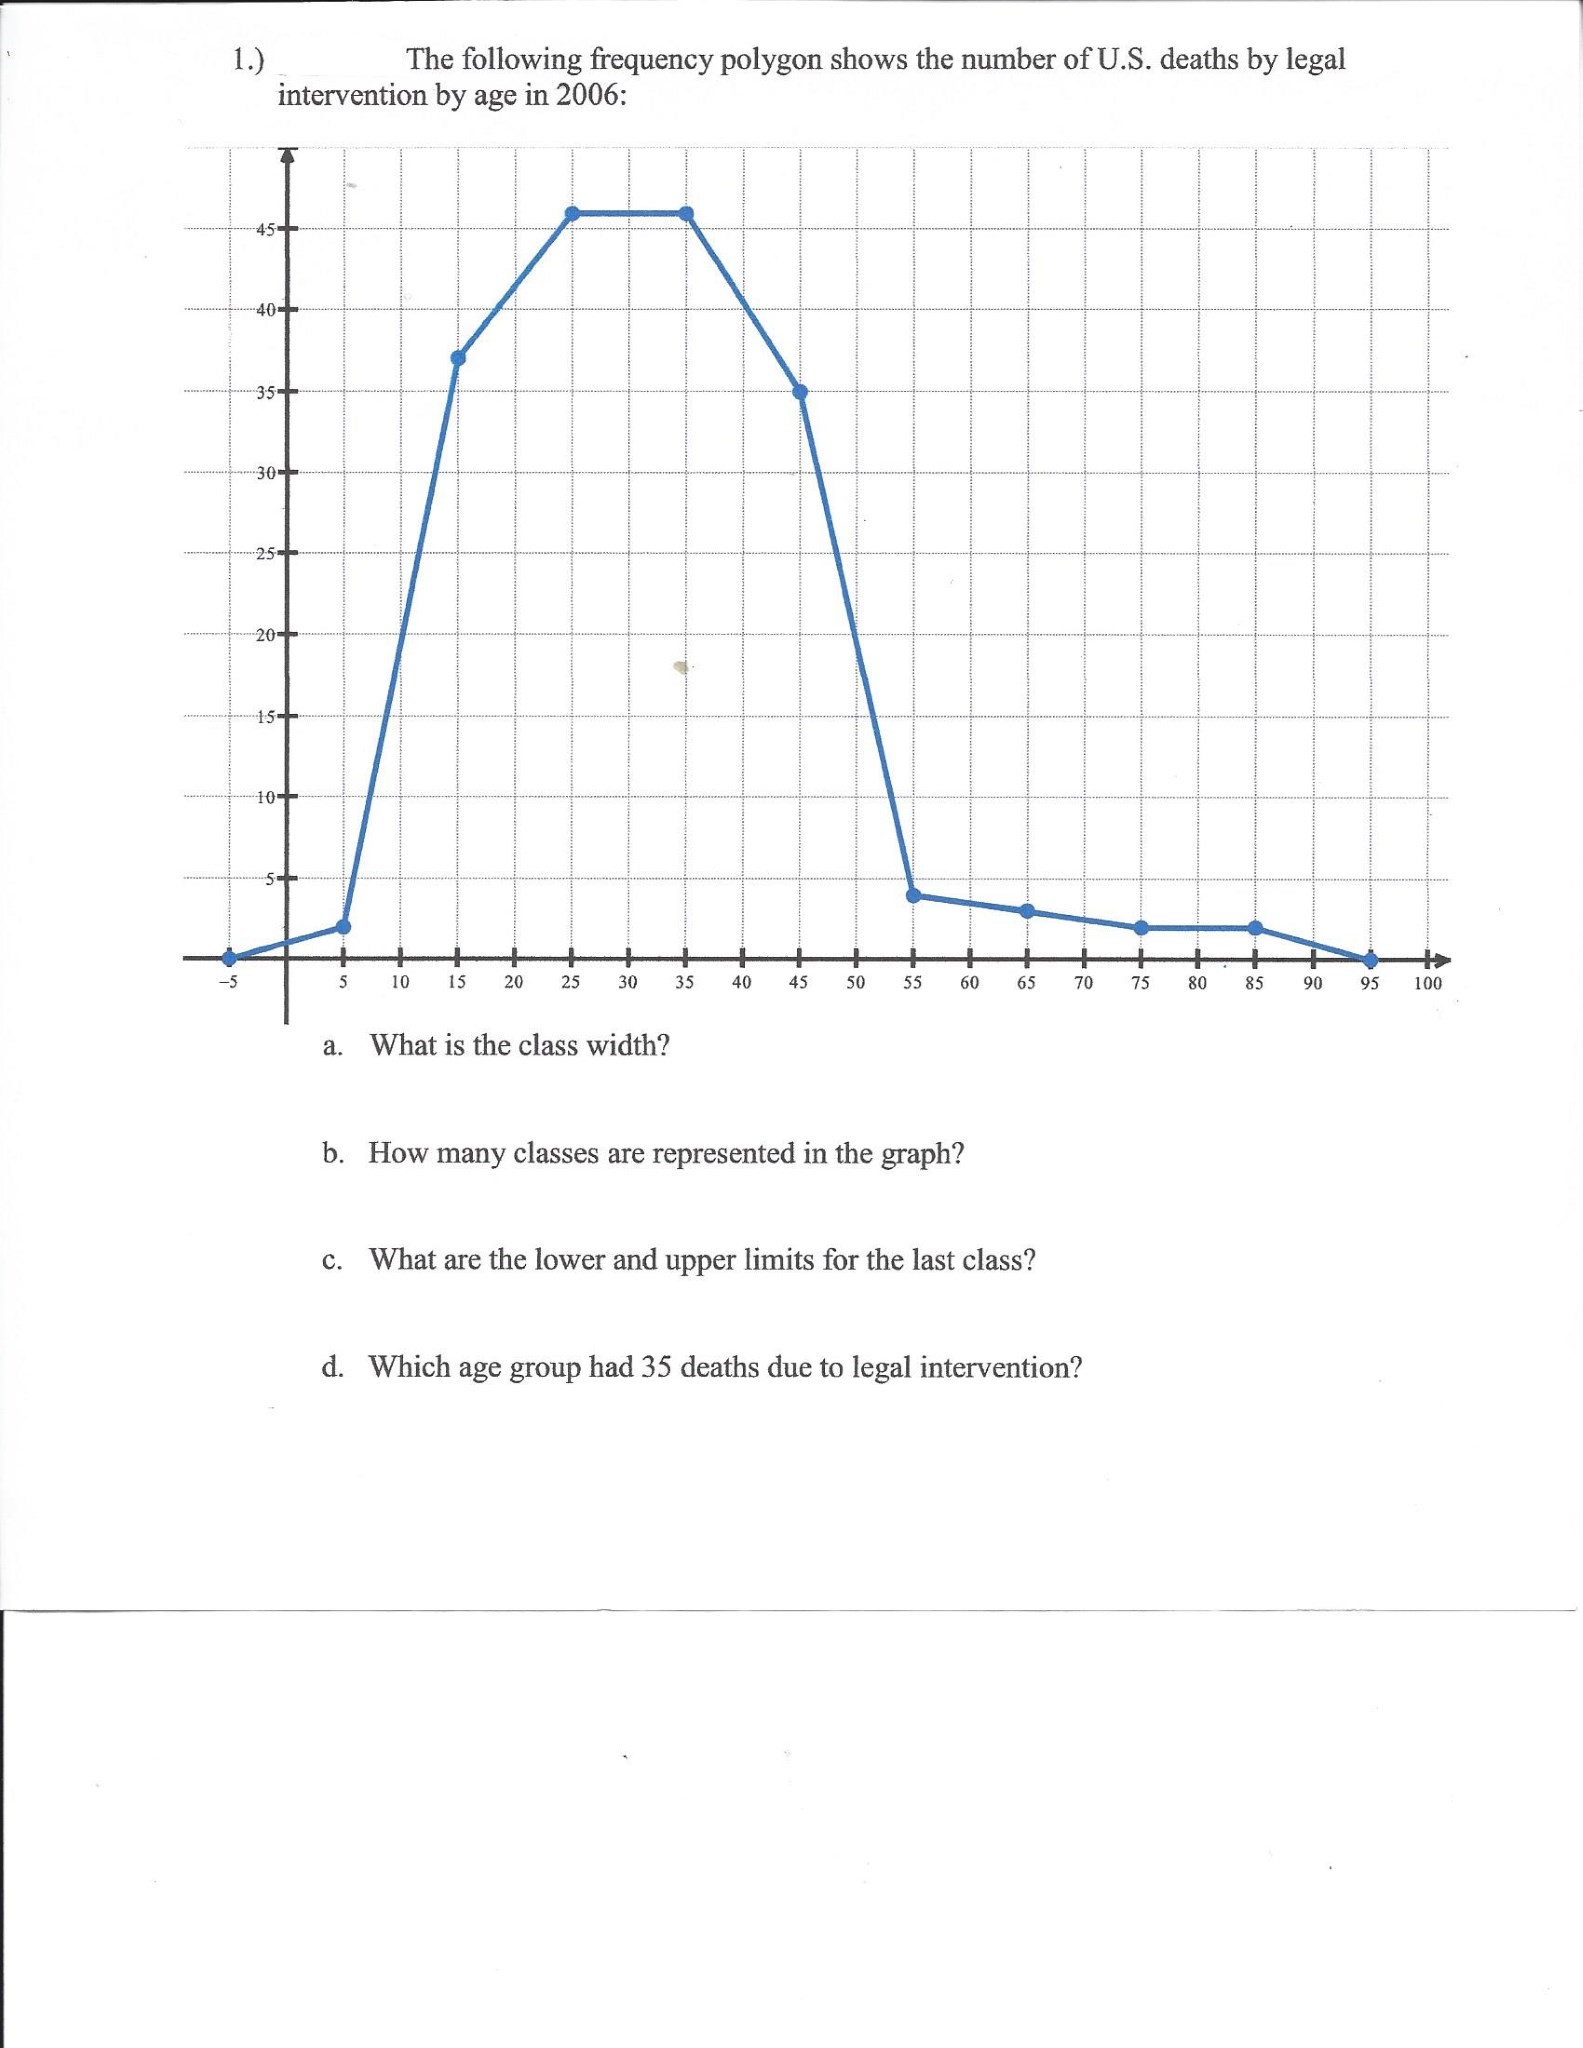
I.) 7 The following frequency polygon shows the number of US. deaths by legal intervention by age in 2006: IO [5 20 25 30 35 a. What is the class width? b. How many classes are represented in the graph? G. What are the lower and upper limits for the last class? (1. Which age group had 35 deaths due to legal intervention
Step by Step Solution
There are 3 Steps involved in it
1 Expert Approved Answer
Step: 1 Unlock

Question Has Been Solved by an Expert!
Get step-by-step solutions from verified subject matter experts
Step: 2 Unlock
Step: 3 Unlock