

Question: need help with this question A financial Scientist studying the effect of different strategies has serious concerns about the use of historical data for backtesting
need help with this question
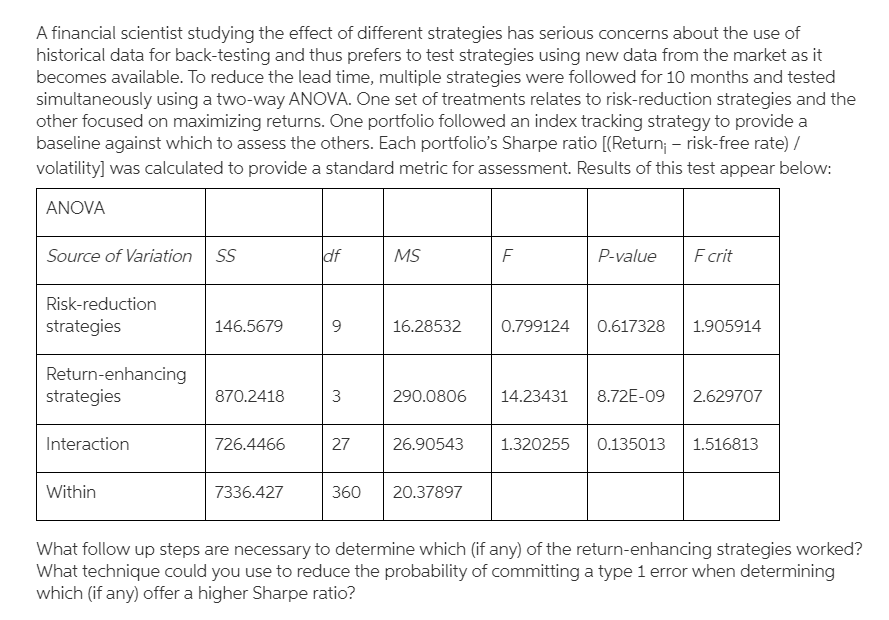
A financial Scientist studying the effect of different strategies has serious concerns about the use of historical data for backtesting and thus prefers to test strategies using new data from the market as it becomes available. To reduce the lead time, multiple strategies were followed for 10 months and tested simultaneously using a twoway ANOVA. One set of treatments relates to riskreduction strategies and the other focused on maximizing returns. One portfolio followed an index tracking strategy to provide a baseline against which to assess the others. Each portfolio's Sharpe ratio [(Returni riskfree rate] I volatility] was calculated to provide a standard metric for assessment. Results of this test appear below: ANOVA Source of Variation SS o'f MS F P vafue F crit Riskreduction strategies 146.5679 9 16.28532 0.799124 0.617328 1.905914 Returnenhancing strategies 870.2418 3 290.0806 14.23431 8.72E09 2.629707 lnte faction 726.4466 27 26.90543 1.320255 0.135013 1.516813 Within 7336.427 360 20.37897 What follow up steps are necessary to determine which (if any] of the returnenhancing strategies worked? What technique could you use to reduce the probability of committing a type 1 error when determining which (ifany) offer a higher Sharpe ratio
Step by Step Solution
There are 3 Steps involved in it

Get step-by-step solutions from verified subject matter experts