

Question: Need help with this question. A graphing calculator is recommended. A researcher wants to know if the mean times (in minutes) that people watch their
Need help with this question.
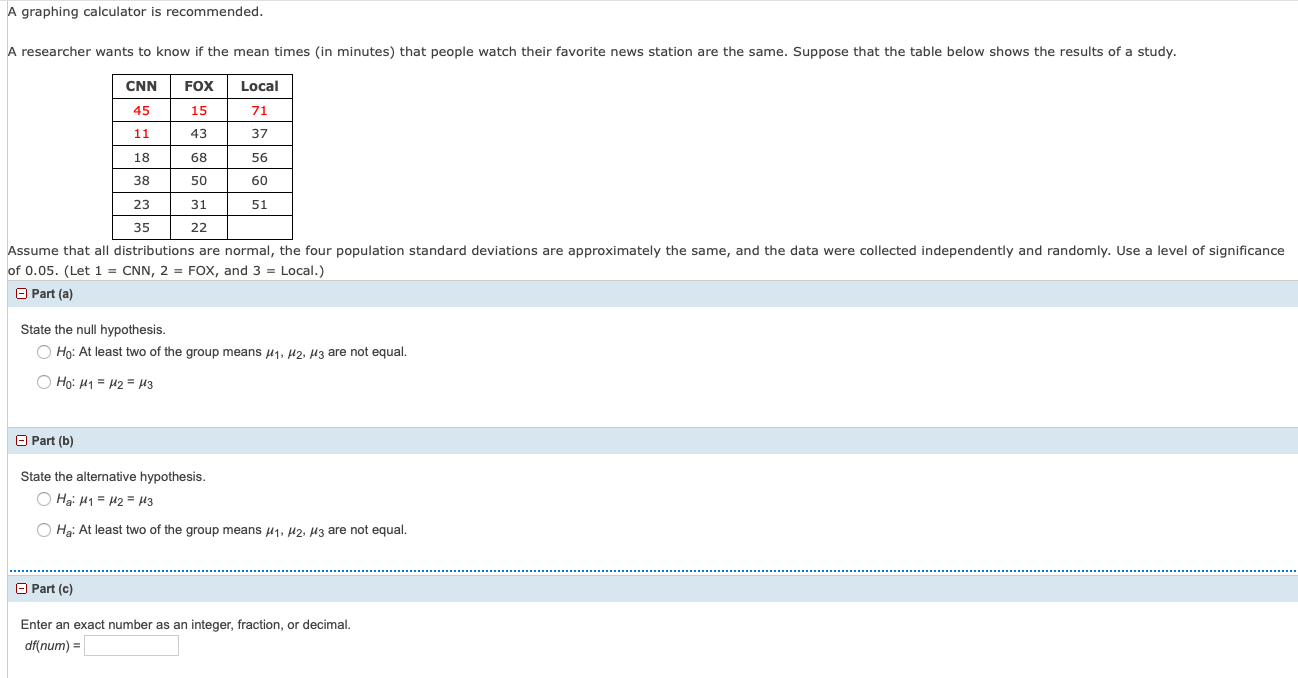
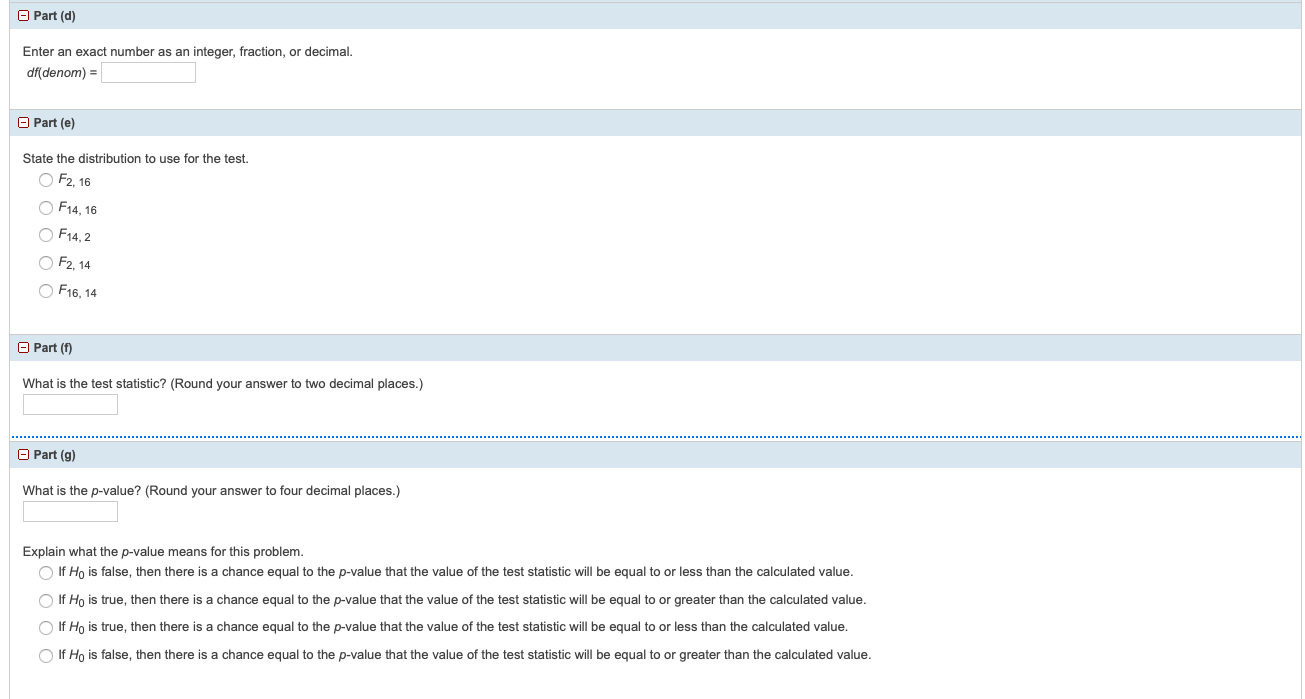
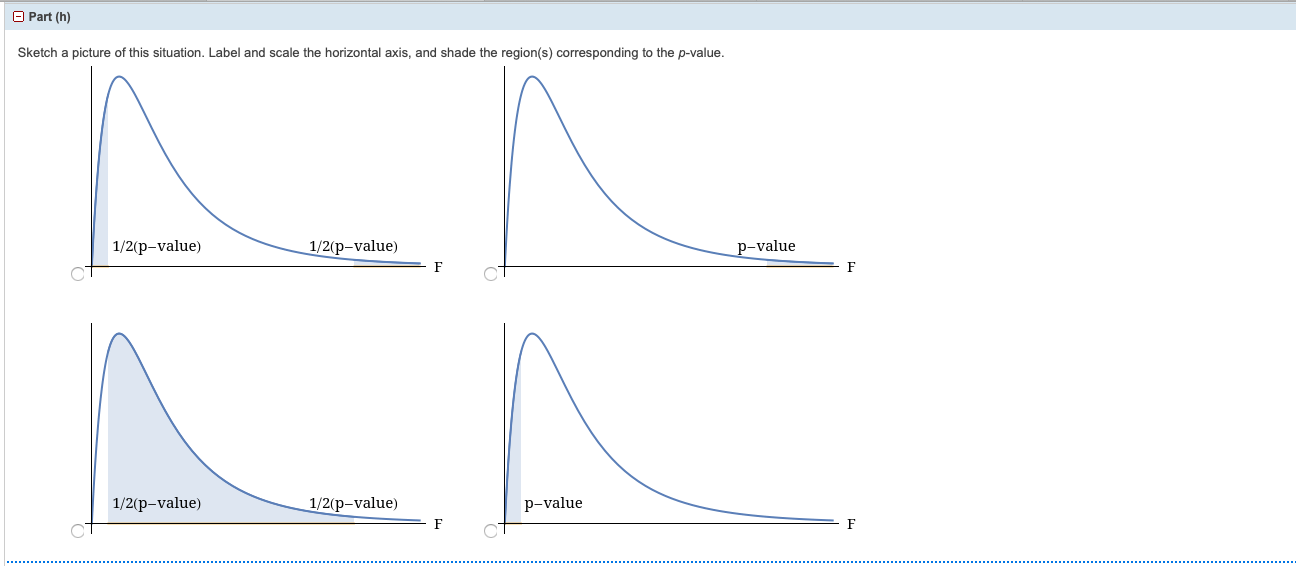
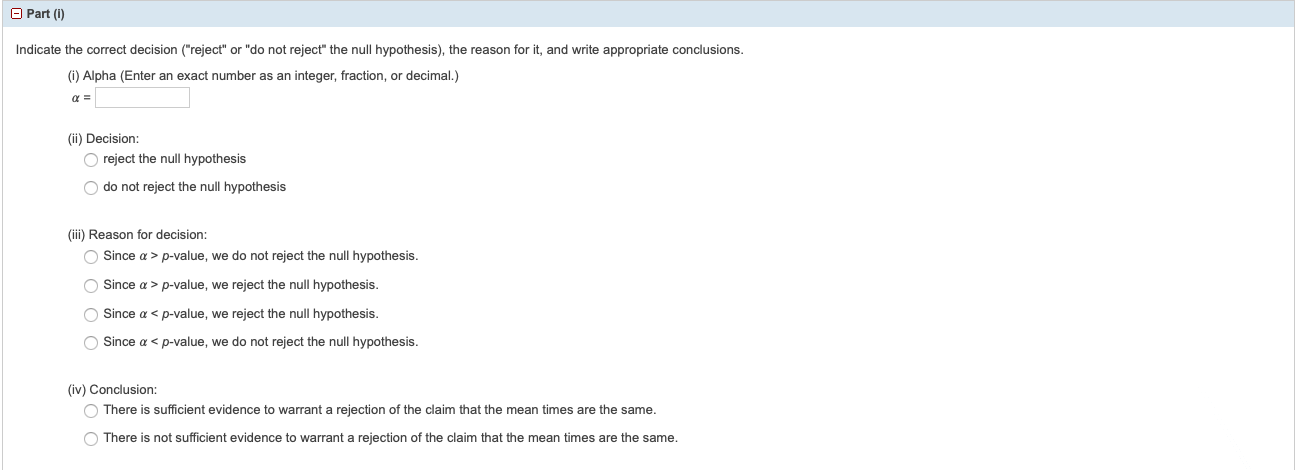
A graphing calculator is recommended. A researcher wants to know if the mean times (in minutes) that people watch their favorite news station are the same. Suppose that the table below shows the results of a study. CNN FOX Local 45 15 71 11 43 37 18 68 56 38 50 60 23 31 51 35 22 Assume that all distributions are normal, the four population standard deviations are approximately the same, and the data were collected independently and randomly. Use a level of significance of 0.05. (Let 1 = CNN, 2 = FOX, and 3 = Local.) Part (a) State the null hypothesis. O Ho: At least two of the group means /1, /2, /3 are not equal. O Ho: M1 = M2 = #3 - Part (b) State the alternative hypothesis. O Hai M1 = M2 = M3 O Ha: At least two of the group means #1, /2, M3 are not equal. - Part (c) Enter an exact number as an integer, fraction, or decimal. df(num) =Part (d) Enter an exact number as an integer, fraction, or decimal. df(denom) = Part (e) State the distribution to use for the test. OF2, 16 OF14, 16 O F14, 2 OF2, 14 O F16, 14 Part (f) What is the test statistic? (Round your answer to two decimal places.) - Part (9) What is the p-value? (Round your answer to four decimal places.) Explain what the p-value means for this problem. O If Ho is false, then there is a chance equal to the p-value that the value of the test statistic will be equal to or less than the calculated value. O If Ho is true, then there is a chance equal to the p-value that the value of the test statistic will be equal to or greater than the calculated value. If Ho is true, then there is a chance equal to the p-value that the value of the test statistic will be equal to or less than the calculated value. O If Ho is false, then there is a chance equal to the p-value that the value of the test statistic will be equal to or greater than the calculated value.- Part (h) Sketch a picture of this situation. Label and scale the horizontal axis, and shade the region(s) corresponding to the p-value. 1/2(p-value) 1/2(p-value) p-value F F 1/2(p-value) 1/2(p-value) p-value F FPart (1) Indicate the correct decision ("reject" or "do not reject" the null hypothesis), the reason for it, and write appropriate conclusions. (i) Alpha (Enter an exact number as an integer, fraction, or decimal.) a = (ii) Decision: O reject the null hypothesis O do not reject the null hypothesis (iii) Reason for decision: Since a > p-value, we do not reject the null hypothesis. Since a > p-value, we reject the null hypothesis. Since a
Step by Step Solution
There are 3 Steps involved in it

Get step-by-step solutions from verified subject matter experts