

Question: Need help with this question and the subparts CCCCCCCCCCCCCCCCCCCCCCCCCCCCCCCCCCCCCCCCCCCCCCCCCCCCCCCCCCCCCCCC C. A research team studied how Y, the protein production of a laboratory animal, could be
Need help with this question and the subparts
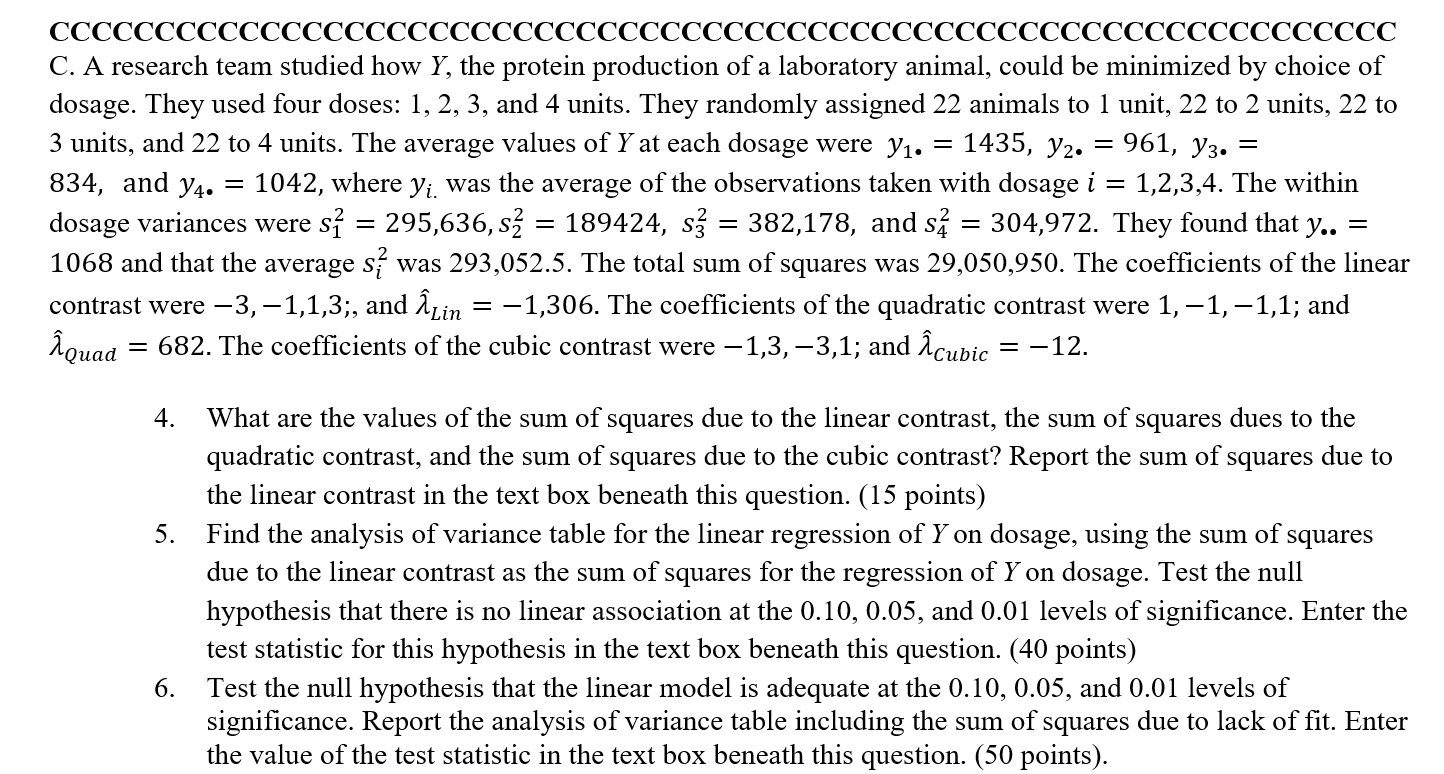
CCCCCCCCCCCCCCCCCCCCCCCCCCCCCCCCCCCCCCCCCCCCCCCCCCCCCCCCCCCCCCCC C. A research team studied how Y, the protein production of a laboratory animal, could be minimized by choice of dosage. They used four doses: 1, 2, 3, and 4 units. They randomly assigned 22 animals to 1 unit, 22 to 2 units, 22 to 3 units, and 22 to 4 units. The average values of Y at each dosage were y1. = 1435, y2. = 961, y3. = 834, and y4. = 1042, where yi. was the average of the observations taken with dosage i = 1,2,3,4. The within dosage variances were s? = 295,636, $2 = 189424, S? = 382,178, and s4 = 304,972. They found that y.. = 1068 and that the average s, was 293,052.5. The total sum of squares was 29,050,950. The coefficients of the linear contrast were -3, -1,1,3;, and ALin = -1,306. The coefficients of the quadratic contrast were 1, -1, -1,1; and Quad = 682. The coefficients of the cubic contrast were -1,3, -3,1; and Acubic = -12. 4. What are the values of the sum of squares due to the linear contrast, the sum of squares dues to the quadratic contrast, and the sum of squares due to the cubic contrast? Report the sum of squares due to the linear contrast in the text box beneath this question. (15 points) 5. Find the analysis of variance table for the linear regression of Y on dosage, using the sum of squares due to the linear contrast as the sum of squares for the regression of Y on dosage. Test the null hypothesis that there is no linear association at the 0.10, 0.05, and 0.01 levels of significance. Enter the test statistic for this hypothesis in the text box beneath this question. (40 points) 6. Test the null hypothesis that the linear model is adequate at the 0.10, 0.05, and 0.01 levels of significance. Report the analysis of variance table including the sum of squares due to lack of fit. Enter the value of the test statistic in the text box beneath this question. (50 points)
Step by Step Solution
There are 3 Steps involved in it

Get step-by-step solutions from verified subject matter experts