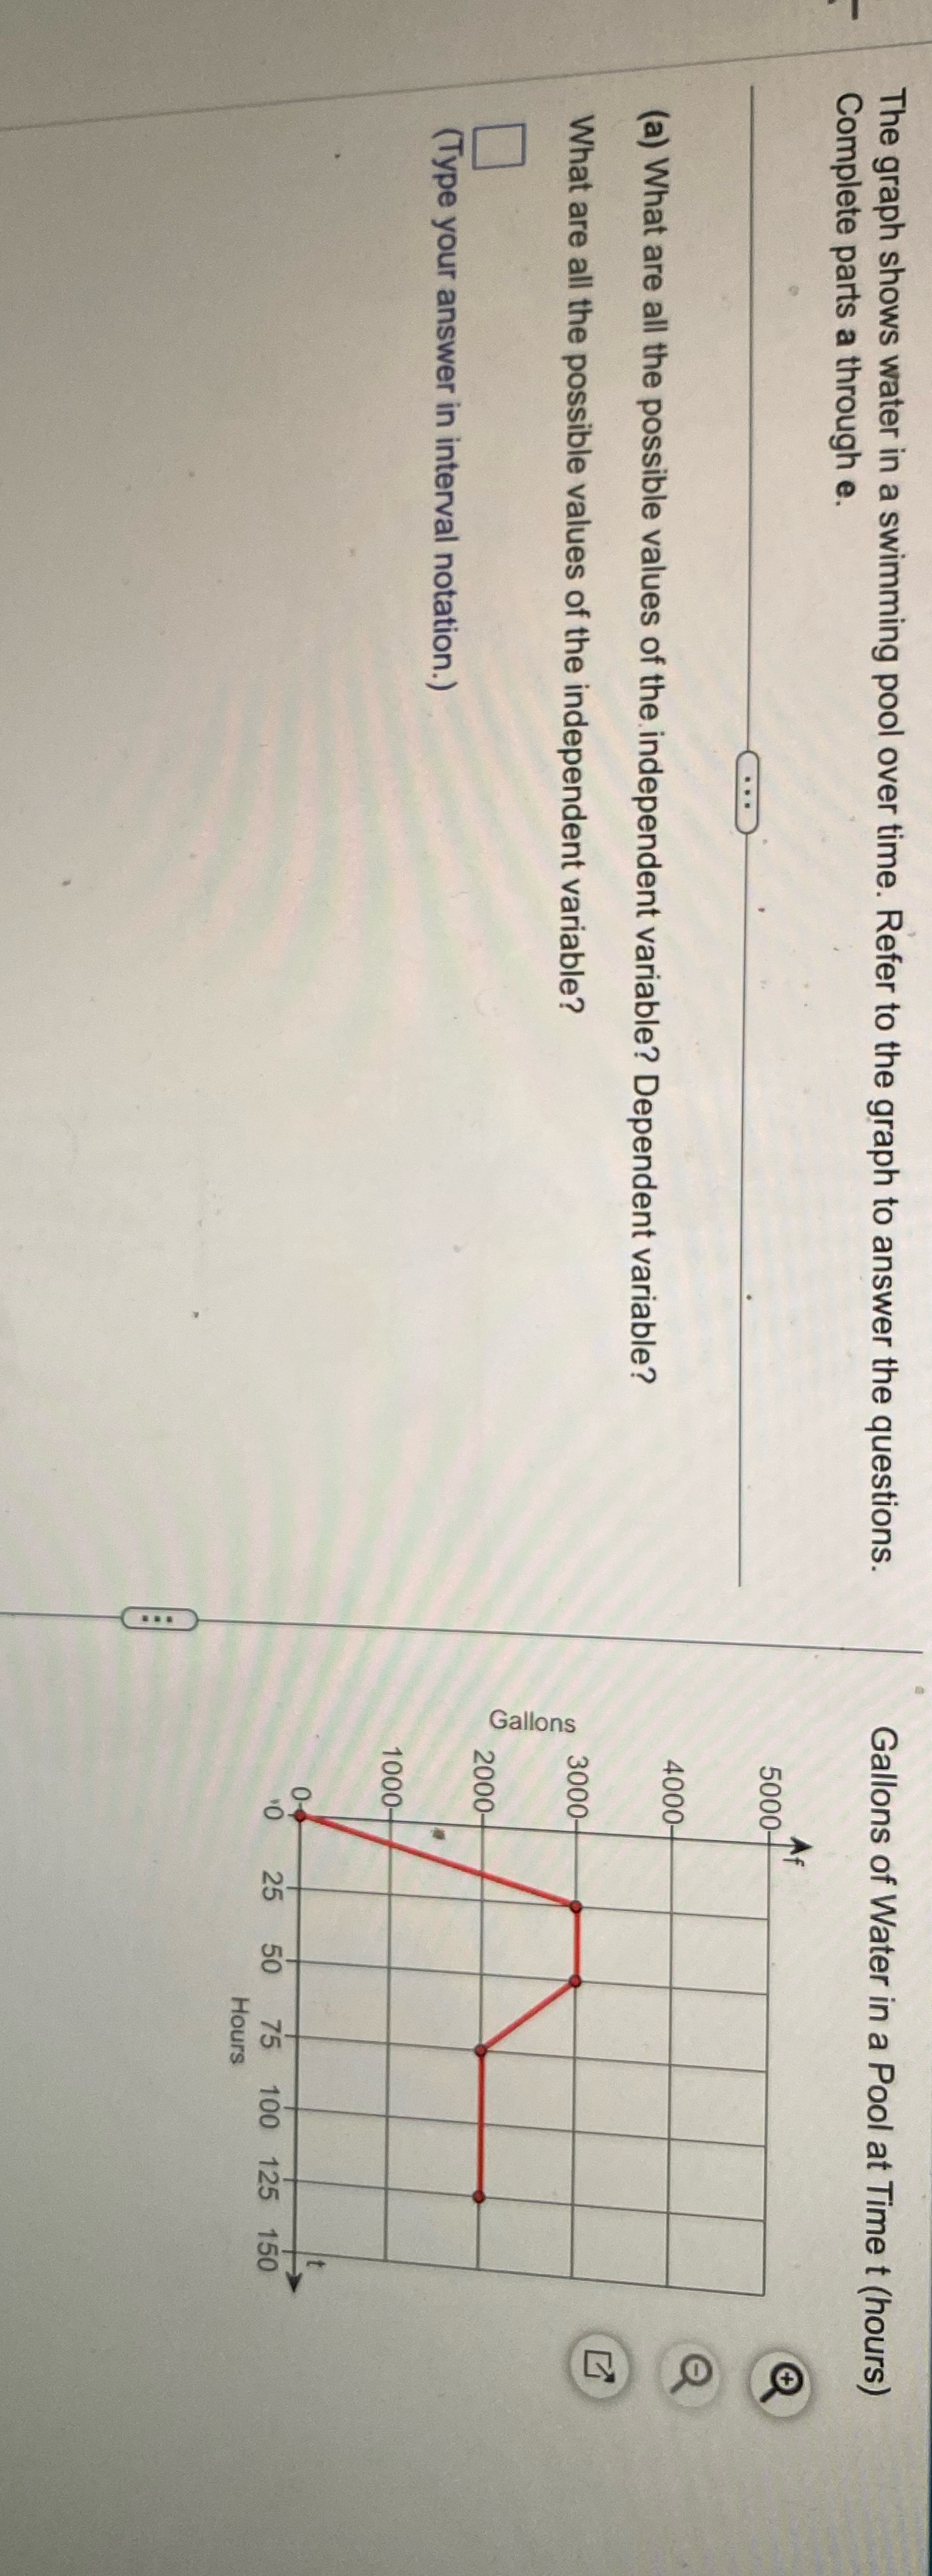
Question: Need help with this The graph shows water in a swimming pool over time. Refer to the graph to answer the questions. Gallons of Water

Need help with this

Need help with this The graph shows water in a
The graph shows water in a swimming pool over time. Refer to the graph to answer the questions. Gallons of Water in a Pool at Time t (hours) Complete parts a through e. 5000 f . . . O 4000- (a) What are all the possible values of the independent variable? Dependent variable? What are all the possible values of the independent variable? 3000- Gallons 2000- (Type your answer in interval notation.) 1000- 50 75 100 125 150 Hours

Step by Step Solution

There are 3 Steps involved in it

1 Expert Approved Answer
Step: 1 Unlock blur-text-image
Question Has Been Solved by an Expert!

Get step-by-step solutions from verified subject matter experts

Step: 2 Unlock
Step: 3 Unlock

Students Have Also Explored These Related Mathematics Questions!