

Question: Need help with understanding and solving below question, check attached image for the complete question, I do no intend to submit the tutor's work as
Need help with understanding and solving below question, check attached image for the complete question, I do no intend to submit the tutor's work as my own but since I am completely new to this I would like to understand and then again attempt on my own referring to the solutions. Please help.
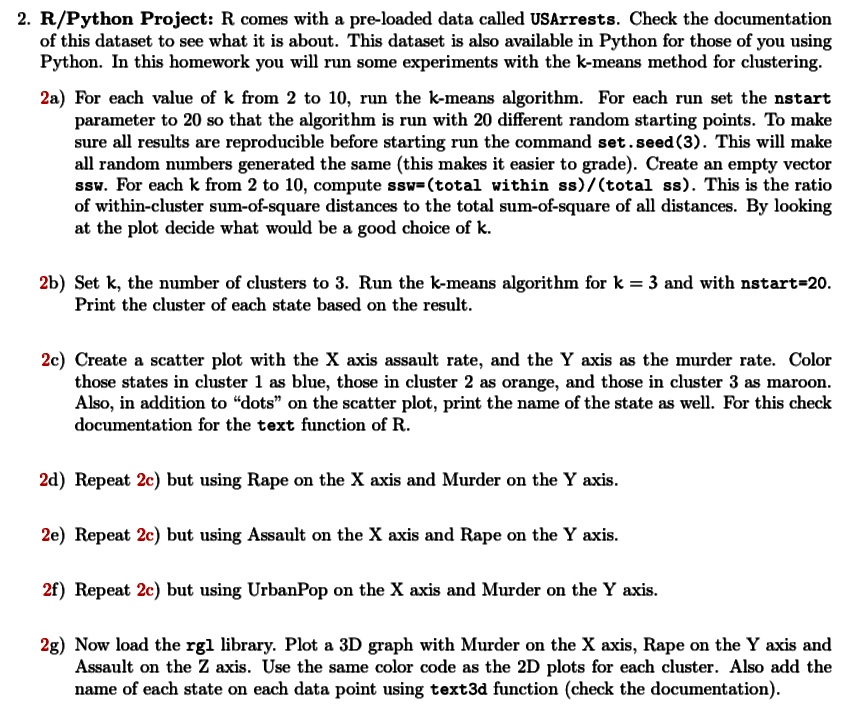
2. R/Python Project: R comes with a pre-loaded data called USArrests. Check the documentation of this dataset to see what it is about. This dataset is also available in Python for those of you using Python. In this homework you will run some experiments with the k-means method for clustering. 2a) For each value of k from 2 to 10, run the k-means algorithm. For each run set the nstart parameter to 20 so that the algorithm is run with 20 different random starting points. To make sure all results are reproducible before starting run the command set . seed (3). This will make all random numbers generated the same (this makes it easier to grade). Create an empty vector ssw. For each k from 2 to 10, compute ssw=(total within ss) /(total ss). This is the ratio of within-cluster sum-of-square distances to the total sum-of-square of all distances. By looking at the plot decide what would be a good choice of k. 2b) Set k, the number of clusters to 3. Run the k-means algorithm for k = 3 and with nstart=20. Print the cluster of each state based on the result. 2c) Create a scatter plot with the X axis assault rate, and the Y axis as the murder rate. Color those states in cluster 1 as blue, those in cluster 2 as orange, and those in cluster 3 as maroon. Also, in addition to "dots" on the scatter plot, print the name of the state as well. For this check documentation for the text function of R. 2d) Repeat 2c) but using Rape on the X axis and Murder on the Y axis. 2e) Repeat 2c) but using Assault on the X axis and Rape on the Y axis. 2f) Repeat 2c) but using UrbanPop on the X axis and Murder on the Y axis. 2g) Now load the rgl library. Plot a 3D graph with Murder on the X axis, Rape on the Y axis and Assault on the Z axis. Use the same color code as the 2D plots for each cluster. Also add the name of each state on each data point using text3d function (check the documentation)
Step by Step Solution
There are 3 Steps involved in it

Get step-by-step solutions from verified subject matter experts