

Question: need homework help! thank you! SECTION 4.3 TRY 4.29 Salaries of College Graduates (Example 3) The scatterplot shows the median starting salaries and the median
need homework help! thank you!
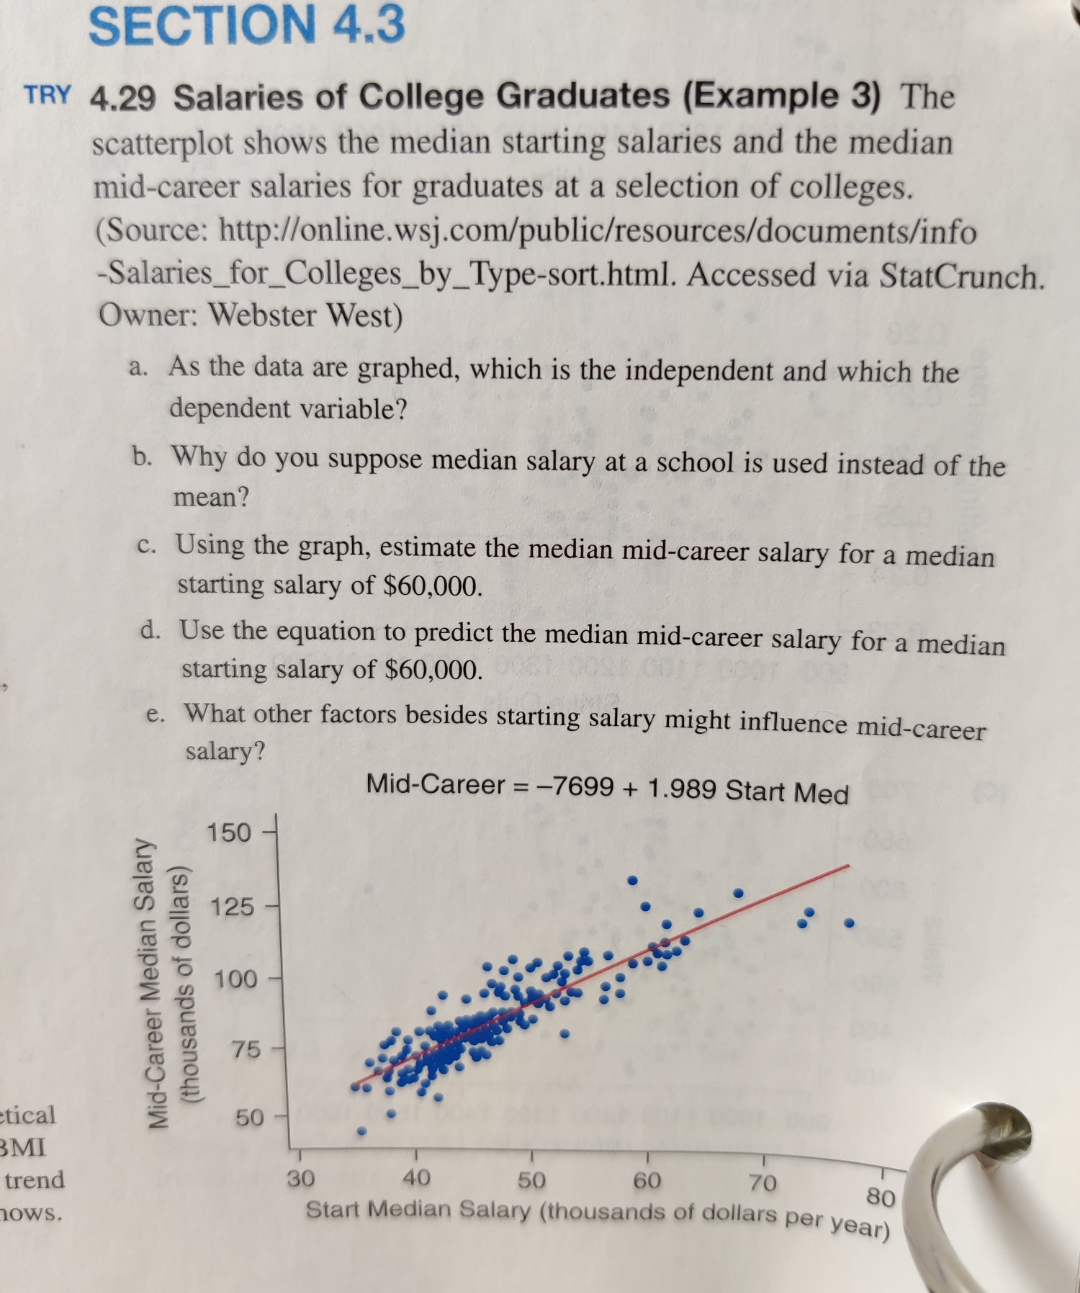
SECTION 4.3 TRY 4.29 Salaries of College Graduates (Example 3) The scatterplot shows the median starting salaries and the median mid-career salaries for graduates at a selection of colleges. (Source: http://online.wsj.com/public/resources/documents/info -Salaries_for_Colleges_by_Type-sort.html. Accessed via StatCrunch. Owner: Webster West) a. As the data are graphed, which is the independent and which the dependent variable? b. Why do you suppose median salary at a school is used instead of the mean? c. Using the graph, estimate the median mid-career salary for a median starting salary of $60,000. d. Use the equation to predict the median mid-career salary for a median starting salary of $60,000. e. What other factors besides starting salary might influence mid-career salary? Mid-Career = -7699 + 1.989 Start Med 150 125 (thousands of dollars) Mid-Career Median Salary 100 75 tical 50 MI trend 30 40 50 60 70 80 10WS. Start Median Salary (thousands of dollars per year)
Step by Step Solution
There are 3 Steps involved in it

Get step-by-step solutions from verified subject matter experts