

Question: Need in Excel worksheet with all steps ALso show me Excel functions plz solve within 2 hrs 23. The table below presents the variance -
Need in Excel worksheet with all steps ALso show me Excel functions
plz solve within 2 hrs
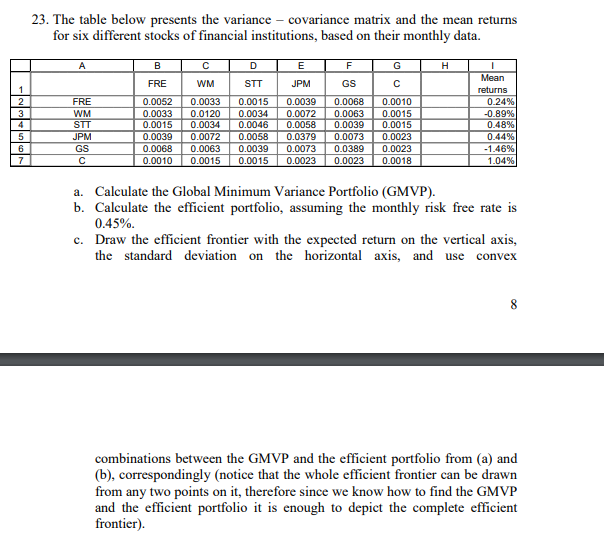
23. The table below presents the variance - covariance matrix and the mean returns for six different stocks of financial institutions, based on their monthly data. A B D E G H F GS FRE WM STT C --- FRE WM STT JPM GS 0.0052 0.0033 0.0015 0.0039 0.0068 0.0010 0.0033 0.0120 0.0034 0.0072 0.0063 0.0015 0.0015 0.0034 0.0046 0.0058 0.0039 0.0015 JPM 0.0039 0.0072 0.0058 0.0379 0.0073 0.0023 0.0068 0.0063 0.0039 0.0073 0.0389 0.0023 0.0010 0.0015 0.0015 0.0023 0.0023 0.0018 Mean returns 0.24% -0.89% 0.48% 0.44% -1.46% 1.04% a. Calculate the Global Minimum Variance Portfolio (GMVP). b. Calculate the efficient portfolio, assuming the monthly risk free rate is 0.45%. c. Draw the efficient frontier with the expected return on the vertical axis, the standard deviation on the horizontal axis, and use convex 8 combinations between the GMVP and the efficient portfolio from (a) and (b), correspondingly (notice that the whole efficient frontier can be drawn from any two points on it, therefore since we know how to find the GMVP and the efficient portfolio it is enough to depict the complete efficient frontier)
Step by Step Solution
There are 3 Steps involved in it

Get step-by-step solutions from verified subject matter experts