

Question: Need number 2 answered for matlab, we just learned the basics of statistics. 1. Create a 100,000-element vector filled with Gaussian random numbers using the
 Need number 2 answered for matlab, we just learned the basics of statistics.
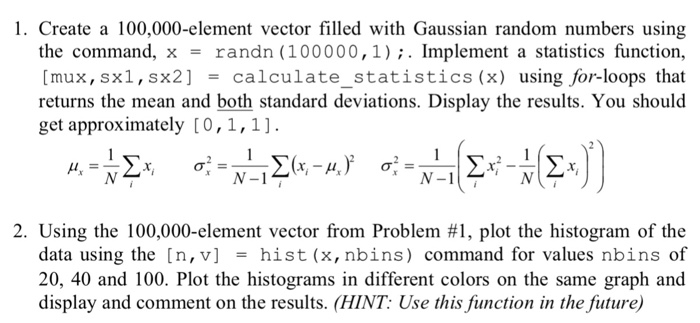
 1. Create a 100,000-element vector filled with Gaussian random numbers using the command, x = randn (100000,1); . Implement a statistics function, [mux, sx1,sx2] = calculate-statistics (x) using for-loops that get approximately [0, 1,1] 2. Using the 100.000-element vector from Problem #1, plot the histogram of the data using the [n, v] = hist (x,nbins) command for values nbins of 20, 40 and 100. Plot the histograms in different colors on the same graph and display and comment on the results. (HINT: Use this function in the future)
Step by Step Solution
There are 3 Steps involved in it
1 Expert Approved Answer
Step: 1 Unlock

Question Has Been Solved by an Expert!
Get step-by-step solutions from verified subject matter experts
Step: 2 Unlock
Step: 3 Unlock