

Question: NEED ONLY THE MULTIPLE STEP BUDGET INCOME STATMENT. ( G) AND THE BUDGET BALANCE SHEET THANKS. NEED THIS TO BE SOLVED Deleon Inc. is preparing
NEED ONLY THE MULTIPLE STEP BUDGET INCOME STATMENT. ( G) AND THE BUDGET BALANCE SHEET THANKS.
 NEED THIS TO BE SOLVED
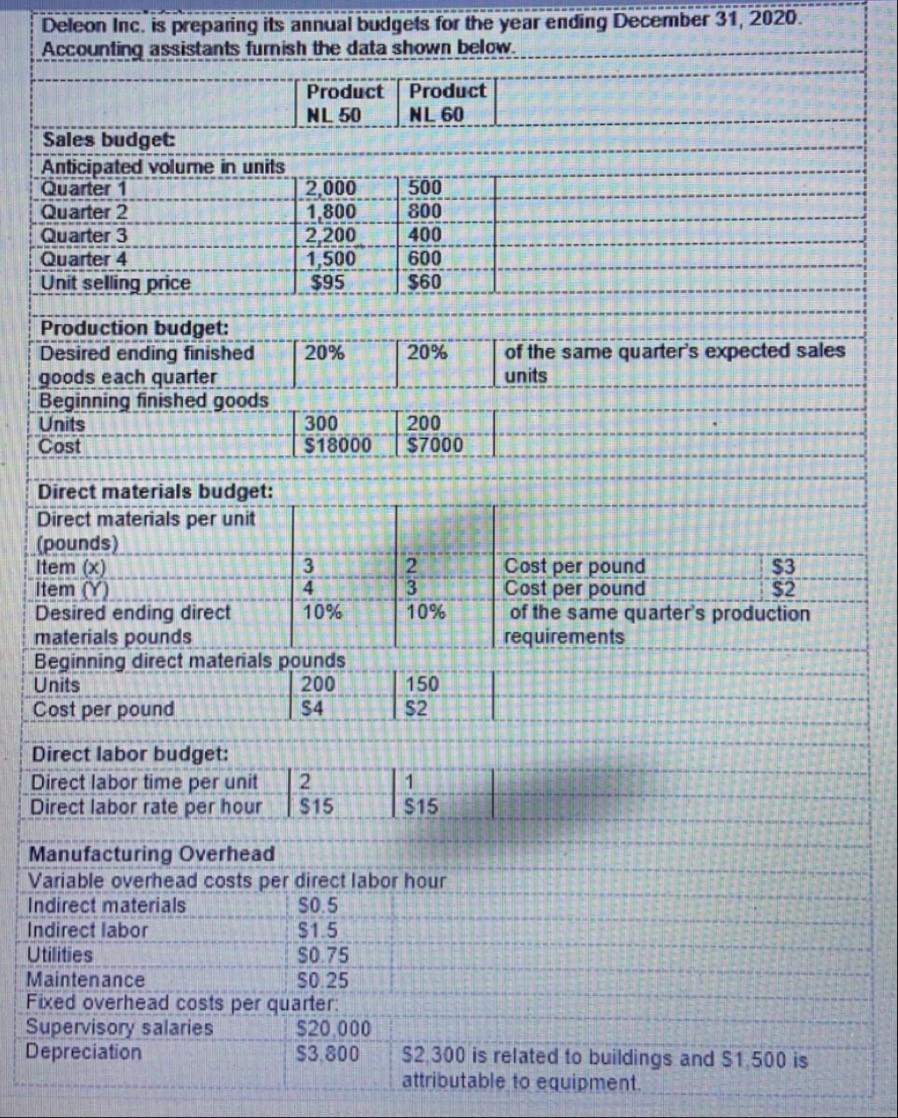
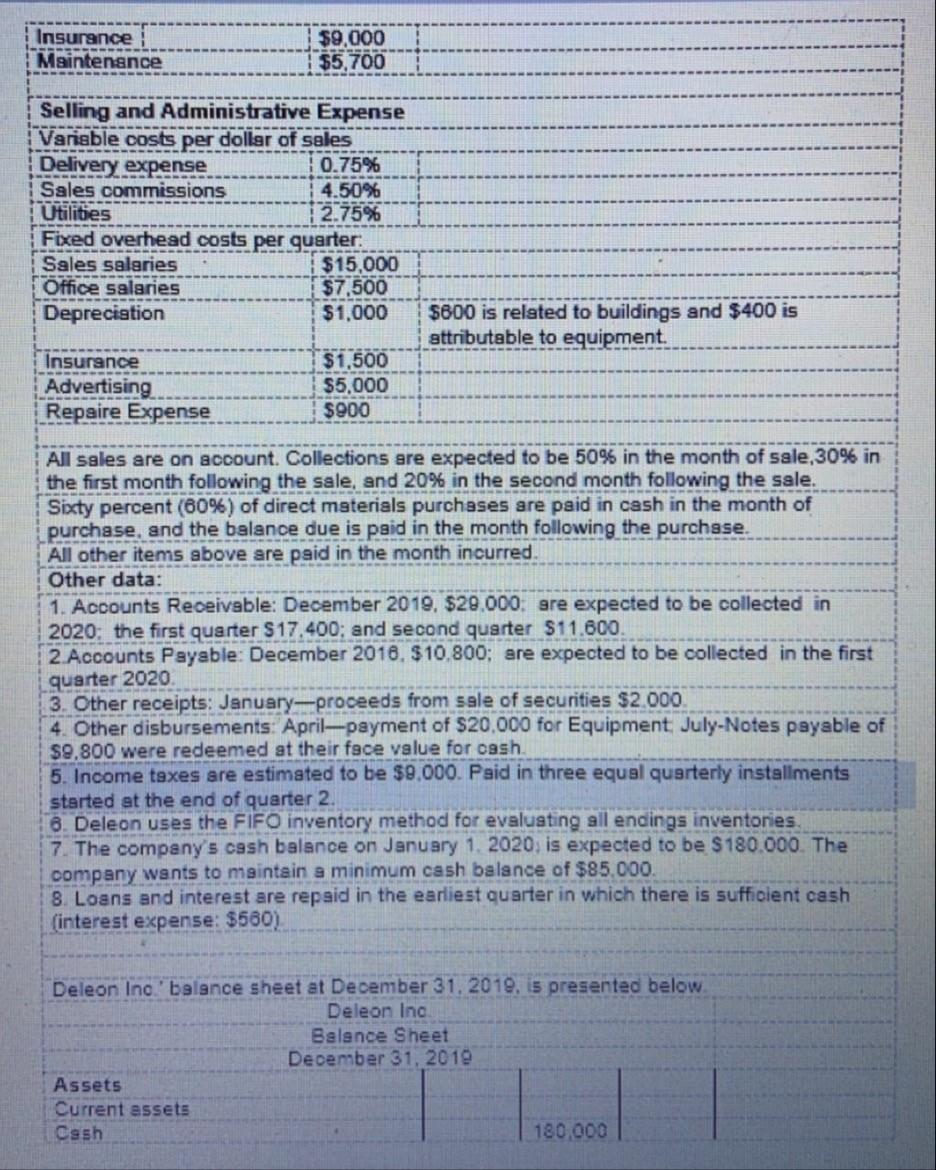
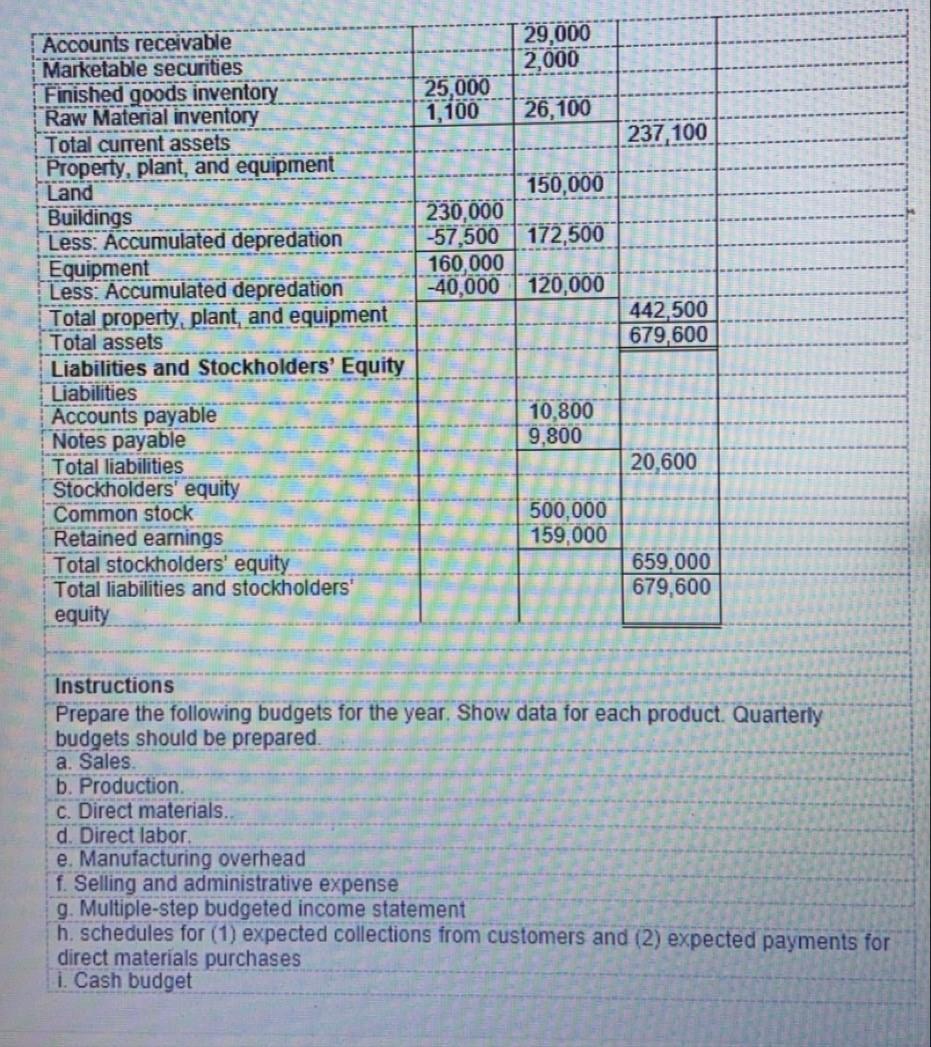
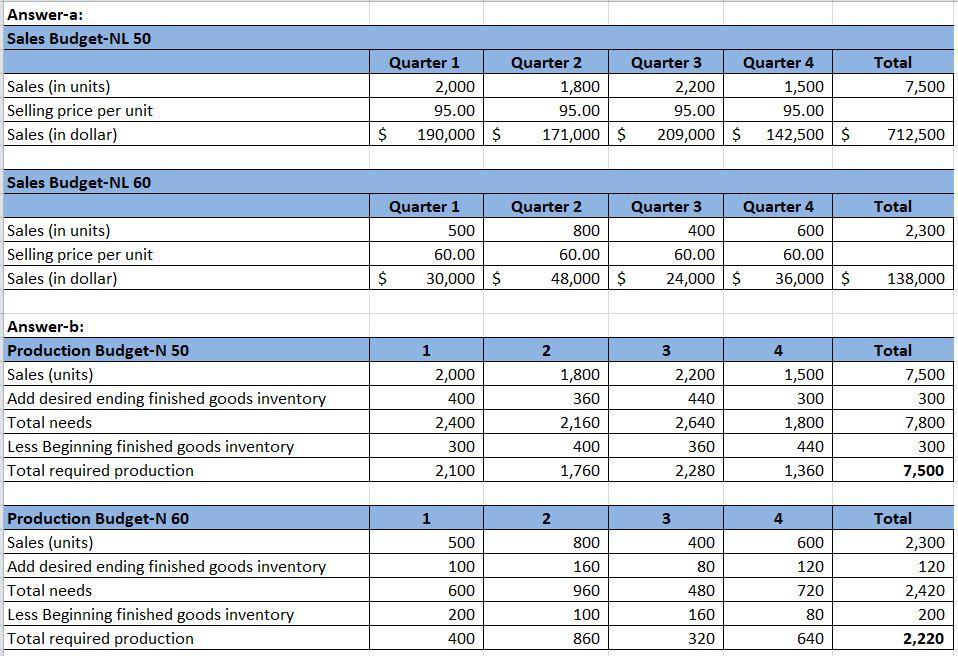
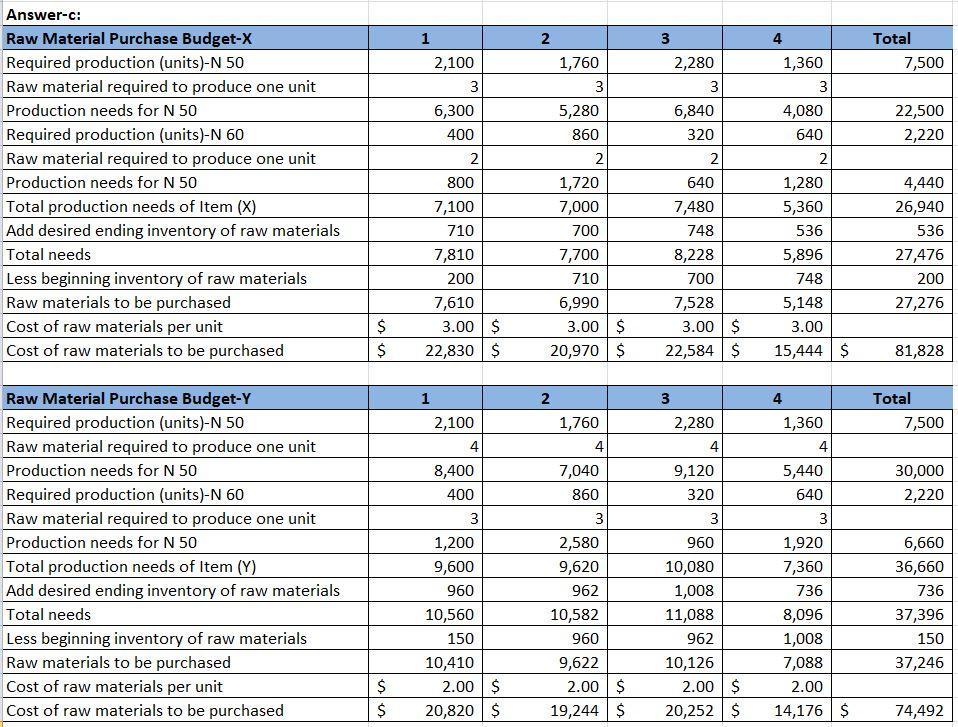
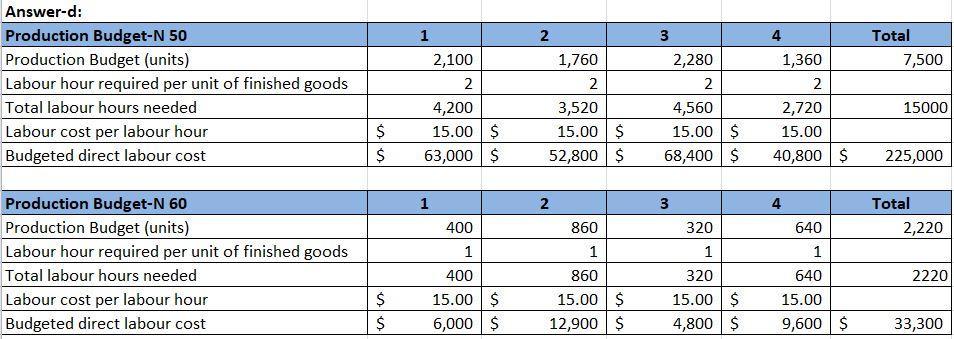
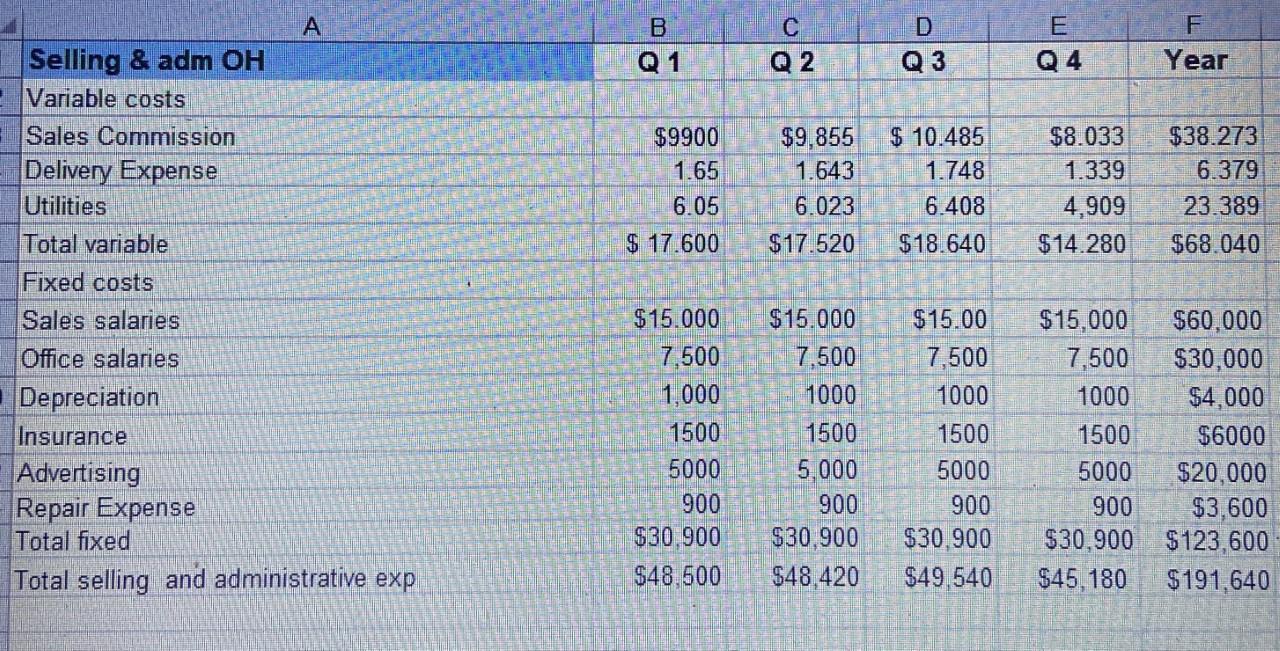
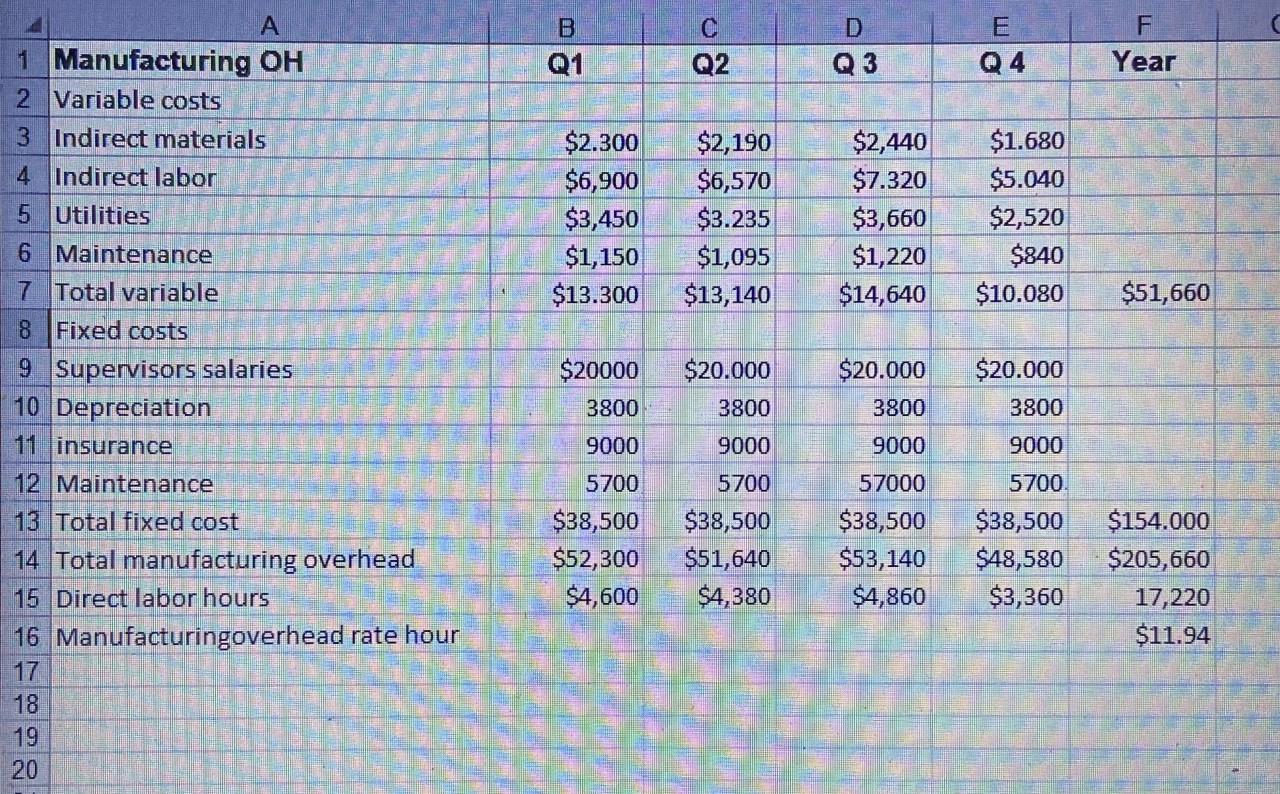
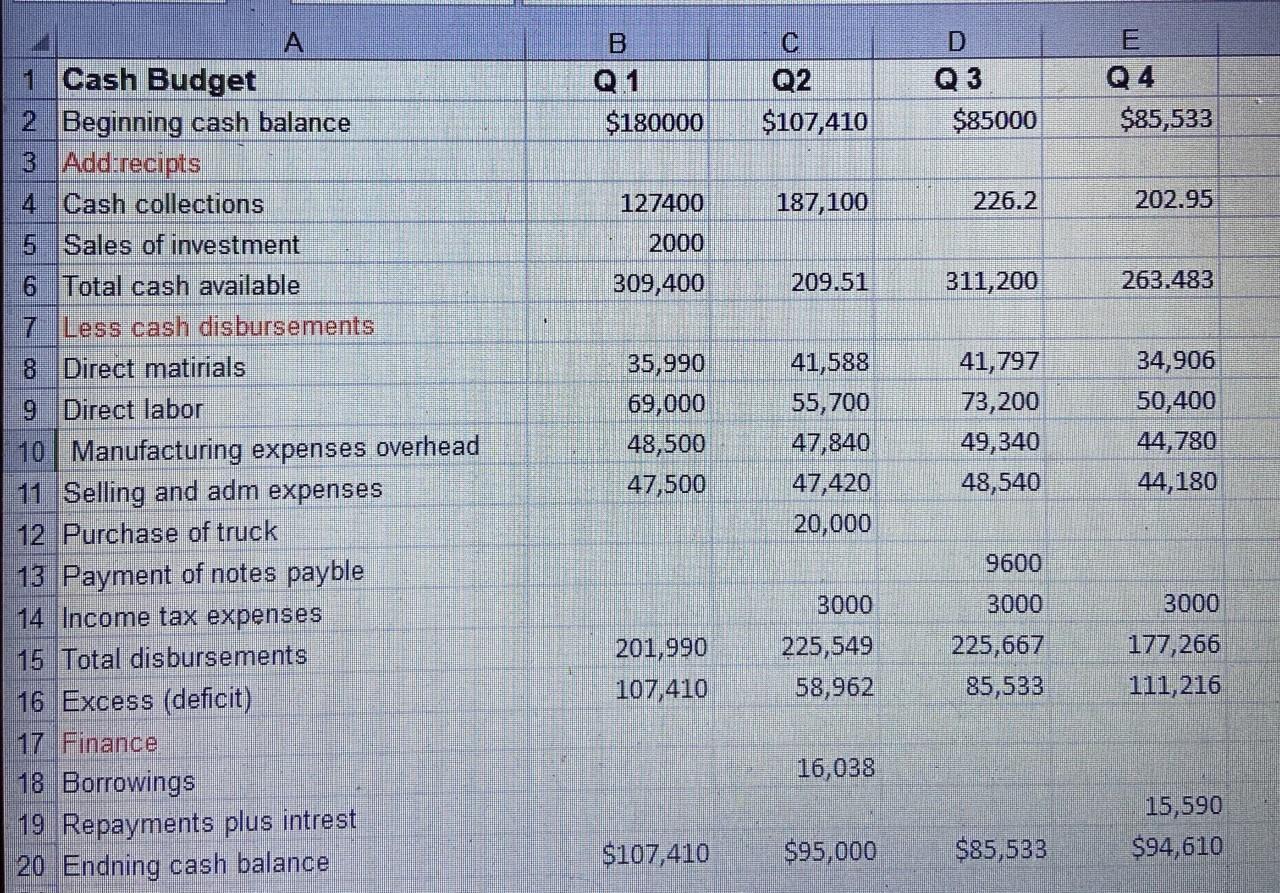
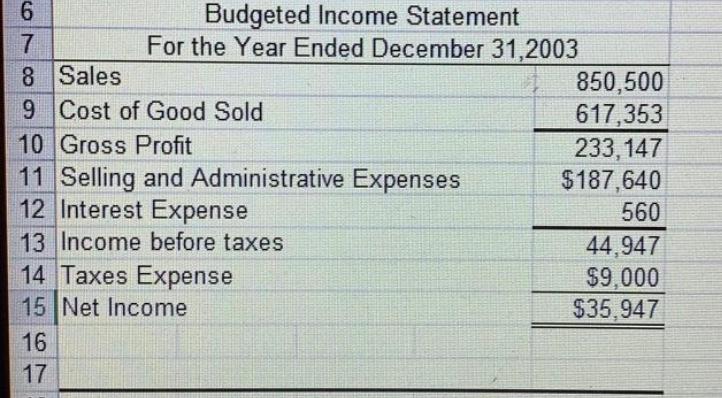
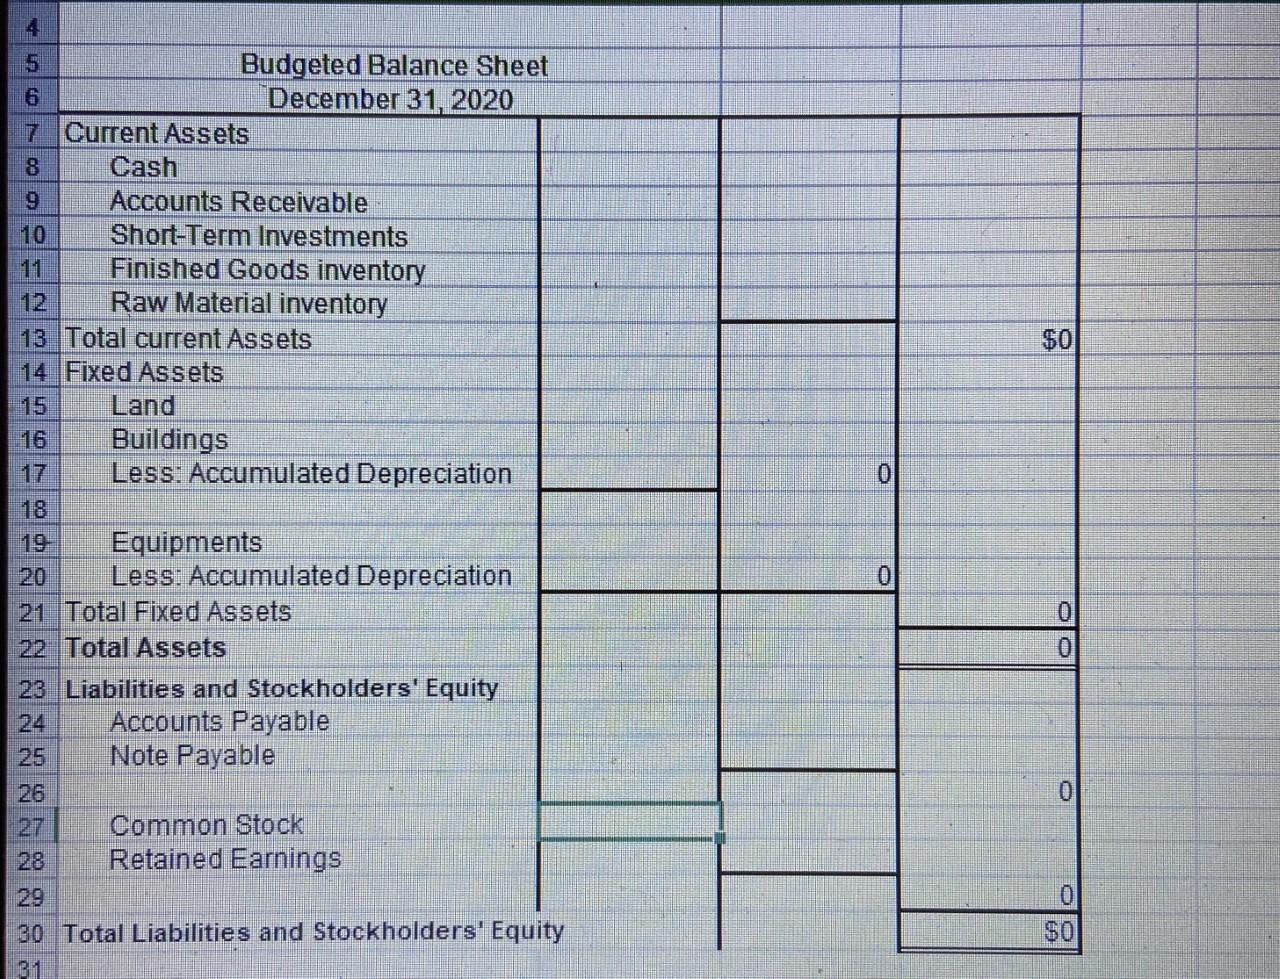
Deleon Inc. is preparing its annual budgets for the year ending December 31, 2020 Accounting assistants furnish the data shown below. Product NL 50 Product NL 60 Sales budget: Anticipated volume in units Quarter 1 Quarter 2. Quarter 3 Quarter 4 Unit selling price 2,000 1,800 2,200 1,500 $95 500 800 400 600 $60 20% 20% of the same quarter's expected sales units Production budget: Desired ending finished goods each quarter Beginning finished goods Units Cost 300 $18000 200 $7000 2 3 si Direct materials budget: Direct materials per unit (pounds) Item (x) 3 Item (Y) 4 Desired ending direct 10% materials pounds Beginning direct materials pounds Units 200 Cost per pound S4 Cost per pound $3 Cost per pound of the same quarter's production requirements 10% 150 $2 Direct labor budget: Direct labor time per unit Direct labor rate per hour 2 S15 1 $15 Manufacturing Overhead Variable overhead costs per direct labor hour Indirect materials S0.5 Indirect labor $1.5 Utilities S0.75 Maintenance S0.25 Fixed overhead costs per quarter: Supervisory salaries $20.000 Depreciation $3,800 $2,300 is related to buildings and $1.500 is attributable to equipment Insurance Maintenance $9,000 $5,700 Selling and Administrative Expense Variable costs per dollar of sales Delivery expense. 0.75% Sales commissions 4.50% Utilities 2.75% Fixed overhead costs per quarter: Sales salaries $15,000 Office salaries $7,500 Depreciation $1,000 $600 is related to buildings and $400 is attributable to equipment. Insurance Advertising Repaire Expense $1,500 $5,000 $900 All sales are on account. Collections are expected to be 50% in the month of sale, 30% in the first month following the sale, and 20% in the second month following the sale. Sixty percent (60%) of direct materials purchases are paid in cash in the month of purchase, and the balance due is paid in the month following the purchase. All other items above are paid in the month incurred. Other data: 1. Accounts Receivable: December 2019, $29.000. are expected to be collected in 2020: the first quarter $17,400; and second quarter $11.600. 2. Accounts Payable: December 2016. $10,800; are expected to be collected in the first quarter 2020 3. Other receipts: January--proceeds from sale of securities $2.000 4. Other disbursements: April-payment of $20,000 for Equipment July-Notes payable of $9,800 were redeemed at their face value for cash 5. Income taxes are estimated to be $9.000. Paid in three equal quarterly installments started at the end of quarter 2. 8. Deleon uses the FIFO inventory method for evaluating all endings inventories. 7. The company's cash balance on January 1, 2020, is expected to be $180.000. The company wants to maintain a minimum cash balance of $85.000 8. Loans and interest are repaid in the earliest quarter in which there is sufficient cash (interest expense: $580) Deleon Inc.' balance sheet at December 31, 2019. is presented below Deleon Inc Balance Sheet December 31, 2018 Assets Current assets Cash 180.000 29,000 2,000 25,000 1,100 26,100 237,100 150,000 230,000 -57,500 172,500 160 000 -40,000 120,000 Accounts receivable Marketable securities Finished goods inventory Raw Material inventory Total current assets Property, plant, and equipment Land Buildings Less: Accumulated depredation Equipment Less: Accumulated depredation Total property, plant and equipment Total assets Liabilities and Stockholders' Equity Liabilities Accounts payable Notes payable Total liabilities Stockholders' equity Common stock Retained earnings Total stockholders' equity Total liabilities and stockholders equity 442,500 679,600 10.800 9,800 500,000 159,000 659.000 679,600 Instructions Prepare the following budgets for the year. Show data for each product. Quarterly budgets should be prepared. a. Sales b. Production C. Direct materials. d. Direct labor e. Manufacturing overhead f. Selling and administrative expense g. Multiple-step budgeted income statement h. schedules for (1) expected collections from customers and (2) expected payments for direct materials purchases i. Cash budget Answer-a: Sales Budget-NL 50 Total 7,500 Sales (in units) Selling price per unit Sales (in dollar) Quarter 1 2,000 95.00 $ 190,000 $ Quarter 2 Quarter 3 Quarter 4 1,800 2,200 1,500 95.00 95.00 95.00 171,000 $ 209,000 $ 142,500 $ 712,500 Sales Budget-NL 60 Total 2,300 Sales (in units Selling price per unit Sales (in dollar) Quarter 1 500 60.00 $ 30,000 $ Quarter 2 Quarter 3 Quarter 4 800 400 600 60.00 60.00 60.00 48,000 $ 24,000 $ 36,000 $ $ 138,000 2 Answer-b: Production Budget-N 50 Sales (units) Add desired ending finished goods inventory Total needs Less Beginning finished goods inventory Total required production 1 2,000 400 2,400 300 2,100 1,800 360 2,160 400 1,760 3 2,200 440 2,640 360 2,280 4 1,500 300 1,800 440 1,360 Total 7,500 300 7,800 300 7,500 1 2 3 4 Production Budget-N 60 Sales (units) Add desired ending finished goods inventory Total needs Less Beginning finished goods inventory Total required production 500 100 600 800 160 960 100 860 400 80 480 160 320 600 120 720 80 640 Total 2,300 120 2,420 200 2,220 200 400 1 4 Total 7,500 Answer-d: Production Budget-N 50 Production Budget (units) Labour hour required per unit of finished goods Total labour hours needed Labour cost per labour hour Budgeted direct labour cost 2,100 2 4,200 15.00$ 63,000 $ 2 1,760 2 3,520 15.00 $ 52,800 $ 3 2,280 2 4,560 15.00 $ 68,400 $ 1,360 2 2,720 15.00 40,800 $ 15000 $ $ 225,000 3 4 Total 2,220 640 1 Production Budget-N 60 Production Budget (units) Labour hour required per unit of finished goods Total labour hours needed Labour cost per labour hour Budgeted direct labour cost 1 400 1 400 15.00$ 6,000 $ 2 860 1 860 15.00 $ 12,900 $ 320 1 320 15.00$ 4,800 $ 640 2220 $ $ 15.00 9,600 $ 33,300 B Q 1 Q2 D Q3 E Q4 F Year $9900 1.65 6.05 $9,855 1.643 6.023 $17.520 $ 10.485 1.748 6.408 $18.640 $8.033 1.339 4,909 $14.280 $38.273 6.379 23.389 $68.040 $ 17.600 Selling & adm OH Variable costs Sales Commission Delivery Expense Utilities Total variable Fixed costs Sales salaries Office salaries Depreciation Insurance Advertising Repair Expense Total fixed Total selling and administrative exp $15.000 7,500 1,000 1500 5000 900 $30,900 $48.500 $15.000 7,500 1000 1500 5,000 900 $30,900 $48,420 $15.00 7,500 1000 1500 5000 900 $30,900 $49.540 $15,000 $60,000 7,500 $30,000 1000 $4,000 1500 $6000 5000 $20,000 900 $3,600 $30,900 $123,600 $45,180 $191,640 C Q2 D Q3 E Q4 F Year Q1 $2.300 $6,900 $3,450 $1,150 $13.300 $2,190 $6,570 $3.235 $1,095 $13,140 $2,440 $7.320 $3,660 $1,220 $14,640 $1.680 $5.040 $2,520 $840 $10.080 $51,660 1 Manufacturing OH 2 Variable costs 3 Indirect materials 4. Indirect labor 5 Utilities 6 Maintenance 7 Total variable 8 Fixed costs 9 Supervisors salaries 10 Depreciation 11 insurance 12 Maintenance 13 Total fixed cost 14 Total manufacturing overhead 15 Direct labor hours 16 Manufacturingoverhead rate hour $20000 3800 $20.000 3800 $20.000 3800 9000 9000 9000 5700 $38,500 $52,300 $4,600 $20.000 3800 9000 5700 $38,500 $51,640 $4,380 57000 $38,500 $53,140 $4,860 5700 $38,500 $48,580 $3,360 $154.000 $205,660 17,220 $11.94 18 19 20 B Q 1 $180000 Q2 D Q3 $85000 Q 4 $85,533 $107,410 127400 187,100 226.2 202.95 2000 309,400 209.51 311,200 263.483 A 1 Cash Budget 2 Beginning cash balance 3 Add:recipts 4 Cash collections 5 Sales of investment 6 Total cash available 7 Less cash disbursements 8 Direct matirials 9 Direct labor 10 Manufacturing expenses overhead 11 Selling and adm expenses 12 Purchase of truck 13 Payment of notes payble 14 Income tax expenses 15 Total disbursements 16 Excess (deficit) 17 Finance 18 Borrowings 19 Repayments plus intrest 20 Endning cash balance 35,990 69,000 48,500 47,500 41,588 55,700 47,840 47,420 20,000 41,797 73,200 49,340 48,540 34,906 50,400 44,780 44,180 9600 3000 201,990 107,410 3000 225,549 58,962 225,667 85,533 3000 177,266 111,216 16,038 15,590 $94,610 $107,410 $95,000 $85,533 6 Budgeted Income Statement 7 For the Year Ended December 31, 2003 8 Sales 850,500 9 Cost of Good Sold 617,353 10 Gross Profit 233,147 11 Selling and Administrative Expenses $187,640 12 Interest Expense 560 13 Income before taxes 44.947 14 Taxes Expense $9,000 15 Net Income $35.947 16 17 4 Budgeted Balance Sheet 6 December 31, 2020 7 Current Assets 8 Cash Accounts Receivable 10 Short-Term Investments Finished Goods inventory Raw Material inventory 13 Total current Assets 14 Fixed Assets 15 Land 16 Buildings Less: Accumulated Depreciation $0 0 0 Equipments 20 Less: Accumulated Depreciation 21 Total Fixed Assets 22 Total Assets 23 Liabilities and Stockholders' Equity 24 Accounts Payable Note Payable 0 Common Stock Retained Earnings 28 0 5 30 Total Liabilities and Stockholders' Equity 31 Deleon Inc. is preparing its annual budgets for the year ending December 31, 2020 Accounting assistants furnish the data shown below. Product NL 50 Product NL 60 Sales budget: Anticipated volume in units Quarter 1 Quarter 2. Quarter 3 Quarter 4 Unit selling price 2,000 1,800 2,200 1,500 $95 500 800 400 600 $60 20% 20% of the same quarter's expected sales units Production budget: Desired ending finished goods each quarter Beginning finished goods Units Cost 300 $18000 200 $7000 2 3 si Direct materials budget: Direct materials per unit (pounds) Item (x) 3 Item (Y) 4 Desired ending direct 10% materials pounds Beginning direct materials pounds Units 200 Cost per pound S4 Cost per pound $3 Cost per pound of the same quarter's production requirements 10% 150 $2 Direct labor budget: Direct labor time per unit Direct labor rate per hour 2 S15 1 $15 Manufacturing Overhead Variable overhead costs per direct labor hour Indirect materials S0.5 Indirect labor $1.5 Utilities S0.75 Maintenance S0.25 Fixed overhead costs per quarter: Supervisory salaries $20.000 Depreciation $3,800 $2,300 is related to buildings and $1.500 is attributable to equipment Insurance Maintenance $9,000 $5,700 Selling and Administrative Expense Variable costs per dollar of sales Delivery expense. 0.75% Sales commissions 4.50% Utilities 2.75% Fixed overhead costs per quarter: Sales salaries $15,000 Office salaries $7,500 Depreciation $1,000 $600 is related to buildings and $400 is attributable to equipment. Insurance Advertising Repaire Expense $1,500 $5,000 $900 All sales are on account. Collections are expected to be 50% in the month of sale, 30% in the first month following the sale, and 20% in the second month following the sale. Sixty percent (60%) of direct materials purchases are paid in cash in the month of purchase, and the balance due is paid in the month following the purchase. All other items above are paid in the month incurred. Other data: 1. Accounts Receivable: December 2019, $29.000. are expected to be collected in 2020: the first quarter $17,400; and second quarter $11.600. 2. Accounts Payable: December 2016. $10,800; are expected to be collected in the first quarter 2020 3. Other receipts: January--proceeds from sale of securities $2.000 4. Other disbursements: April-payment of $20,000 for Equipment July-Notes payable of $9,800 were redeemed at their face value for cash 5. Income taxes are estimated to be $9.000. Paid in three equal quarterly installments started at the end of quarter 2. 8. Deleon uses the FIFO inventory method for evaluating all endings inventories. 7. The company's cash balance on January 1, 2020, is expected to be $180.000. The company wants to maintain a minimum cash balance of $85.000 8. Loans and interest are repaid in the earliest quarter in which there is sufficient cash (interest expense: $580) Deleon Inc.' balance sheet at December 31, 2019. is presented below Deleon Inc Balance Sheet December 31, 2018 Assets Current assets Cash 180.000 29,000 2,000 25,000 1,100 26,100 237,100 150,000 230,000 -57,500 172,500 160 000 -40,000 120,000 Accounts receivable Marketable securities Finished goods inventory Raw Material inventory Total current assets Property, plant, and equipment Land Buildings Less: Accumulated depredation Equipment Less: Accumulated depredation Total property, plant and equipment Total assets Liabilities and Stockholders' Equity Liabilities Accounts payable Notes payable Total liabilities Stockholders' equity Common stock Retained earnings Total stockholders' equity Total liabilities and stockholders equity 442,500 679,600 10.800 9,800 500,000 159,000 659.000 679,600 Instructions Prepare the following budgets for the year. Show data for each product. Quarterly budgets should be prepared. a. Sales b. Production C. Direct materials. d. Direct labor e. Manufacturing overhead f. Selling and administrative expense g. Multiple-step budgeted income statement h. schedules for (1) expected collections from customers and (2) expected payments for direct materials purchases i. Cash budget Answer-a: Sales Budget-NL 50 Total 7,500 Sales (in units) Selling price per unit Sales (in dollar) Quarter 1 2,000 95.00 $ 190,000 $ Quarter 2 Quarter 3 Quarter 4 1,800 2,200 1,500 95.00 95.00 95.00 171,000 $ 209,000 $ 142,500 $ 712,500 Sales Budget-NL 60 Total 2,300 Sales (in units Selling price per unit Sales (in dollar) Quarter 1 500 60.00 $ 30,000 $ Quarter 2 Quarter 3 Quarter 4 800 400 600 60.00 60.00 60.00 48,000 $ 24,000 $ 36,000 $ $ 138,000 2 Answer-b: Production Budget-N 50 Sales (units) Add desired ending finished goods inventory Total needs Less Beginning finished goods inventory Total required production 1 2,000 400 2,400 300 2,100 1,800 360 2,160 400 1,760 3 2,200 440 2,640 360 2,280 4 1,500 300 1,800 440 1,360 Total 7,500 300 7,800 300 7,500 1 2 3 4 Production Budget-N 60 Sales (units) Add desired ending finished goods inventory Total needs Less Beginning finished goods inventory Total required production 500 100 600 800 160 960 100 860 400 80 480 160 320 600 120 720 80 640 Total 2,300 120 2,420 200 2,220 200 400 1 4 Total 7,500 Answer-d: Production Budget-N 50 Production Budget (units) Labour hour required per unit of finished goods Total labour hours needed Labour cost per labour hour Budgeted direct labour cost 2,100 2 4,200 15.00$ 63,000 $ 2 1,760 2 3,520 15.00 $ 52,800 $ 3 2,280 2 4,560 15.00 $ 68,400 $ 1,360 2 2,720 15.00 40,800 $ 15000 $ $ 225,000 3 4 Total 2,220 640 1 Production Budget-N 60 Production Budget (units) Labour hour required per unit of finished goods Total labour hours needed Labour cost per labour hour Budgeted direct labour cost 1 400 1 400 15.00$ 6,000 $ 2 860 1 860 15.00 $ 12,900 $ 320 1 320 15.00$ 4,800 $ 640 2220 $ $ 15.00 9,600 $ 33,300 B Q 1 Q2 D Q3 E Q4 F Year $9900 1.65 6.05 $9,855 1.643 6.023 $17.520 $ 10.485 1.748 6.408 $18.640 $8.033 1.339 4,909 $14.280 $38.273 6.379 23.389 $68.040 $ 17.600 Selling & adm OH Variable costs Sales Commission Delivery Expense Utilities Total variable Fixed costs Sales salaries Office salaries Depreciation Insurance Advertising Repair Expense Total fixed Total selling and administrative exp $15.000 7,500 1,000 1500 5000 900 $30,900 $48.500 $15.000 7,500 1000 1500 5,000 900 $30,900 $48,420 $15.00 7,500 1000 1500 5000 900 $30,900 $49.540 $15,000 $60,000 7,500 $30,000 1000 $4,000 1500 $6000 5000 $20,000 900 $3,600 $30,900 $123,600 $45,180 $191,640 C Q2 D Q3 E Q4 F Year Q1 $2.300 $6,900 $3,450 $1,150 $13.300 $2,190 $6,570 $3.235 $1,095 $13,140 $2,440 $7.320 $3,660 $1,220 $14,640 $1.680 $5.040 $2,520 $840 $10.080 $51,660 1 Manufacturing OH 2 Variable costs 3 Indirect materials 4. Indirect labor 5 Utilities 6 Maintenance 7 Total variable 8 Fixed costs 9 Supervisors salaries 10 Depreciation 11 insurance 12 Maintenance 13 Total fixed cost 14 Total manufacturing overhead 15 Direct labor hours 16 Manufacturingoverhead rate hour $20000 3800 $20.000 3800 $20.000 3800 9000 9000 9000 5700 $38,500 $52,300 $4,600 $20.000 3800 9000 5700 $38,500 $51,640 $4,380 57000 $38,500 $53,140 $4,860 5700 $38,500 $48,580 $3,360 $154.000 $205,660 17,220 $11.94 18 19 20 B Q 1 $180000 Q2 D Q3 $85000 Q 4 $85,533 $107,410 127400 187,100 226.2 202.95 2000 309,400 209.51 311,200 263.483 A 1 Cash Budget 2 Beginning cash balance 3 Add:recipts 4 Cash collections 5 Sales of investment 6 Total cash available 7 Less cash disbursements 8 Direct matirials 9 Direct labor 10 Manufacturing expenses overhead 11 Selling and adm expenses 12 Purchase of truck 13 Payment of notes payble 14 Income tax expenses 15 Total disbursements 16 Excess (deficit) 17 Finance 18 Borrowings 19 Repayments plus intrest 20 Endning cash balance 35,990 69,000 48,500 47,500 41,588 55,700 47,840 47,420 20,000 41,797 73,200 49,340 48,540 34,906 50,400 44,780 44,180 9600 3000 201,990 107,410 3000 225,549 58,962 225,667 85,533 3000 177,266 111,216 16,038 15,590 $94,610 $107,410 $95,000 $85,533 6 Budgeted Income Statement 7 For the Year Ended December 31, 2003 8 Sales 850,500 9 Cost of Good Sold 617,353 10 Gross Profit 233,147 11 Selling and Administrative Expenses $187,640 12 Interest Expense 560 13 Income before taxes 44.947 14 Taxes Expense $9,000 15 Net Income $35.947 16 17 4 Budgeted Balance Sheet 6 December 31, 2020 7 Current Assets 8 Cash Accounts Receivable 10 Short-Term Investments Finished Goods inventory Raw Material inventory 13 Total current Assets 14 Fixed Assets 15 Land 16 Buildings Less: Accumulated Depreciation $0 0 0 Equipments 20 Less: Accumulated Depreciation 21 Total Fixed Assets 22 Total Assets 23 Liabilities and Stockholders' Equity 24 Accounts Payable Note Payable 0 Common Stock Retained Earnings 28 0 5 30 Total Liabilities and Stockholders' Equity 31
Step by Step Solution
There are 3 Steps involved in it

Get step-by-step solutions from verified subject matter experts