

Question: Need parts C and E Chapter 6... Mind Tap - Cengage Learning What was the age distribution of nurses in Great Britain at the time
Need parts C and E
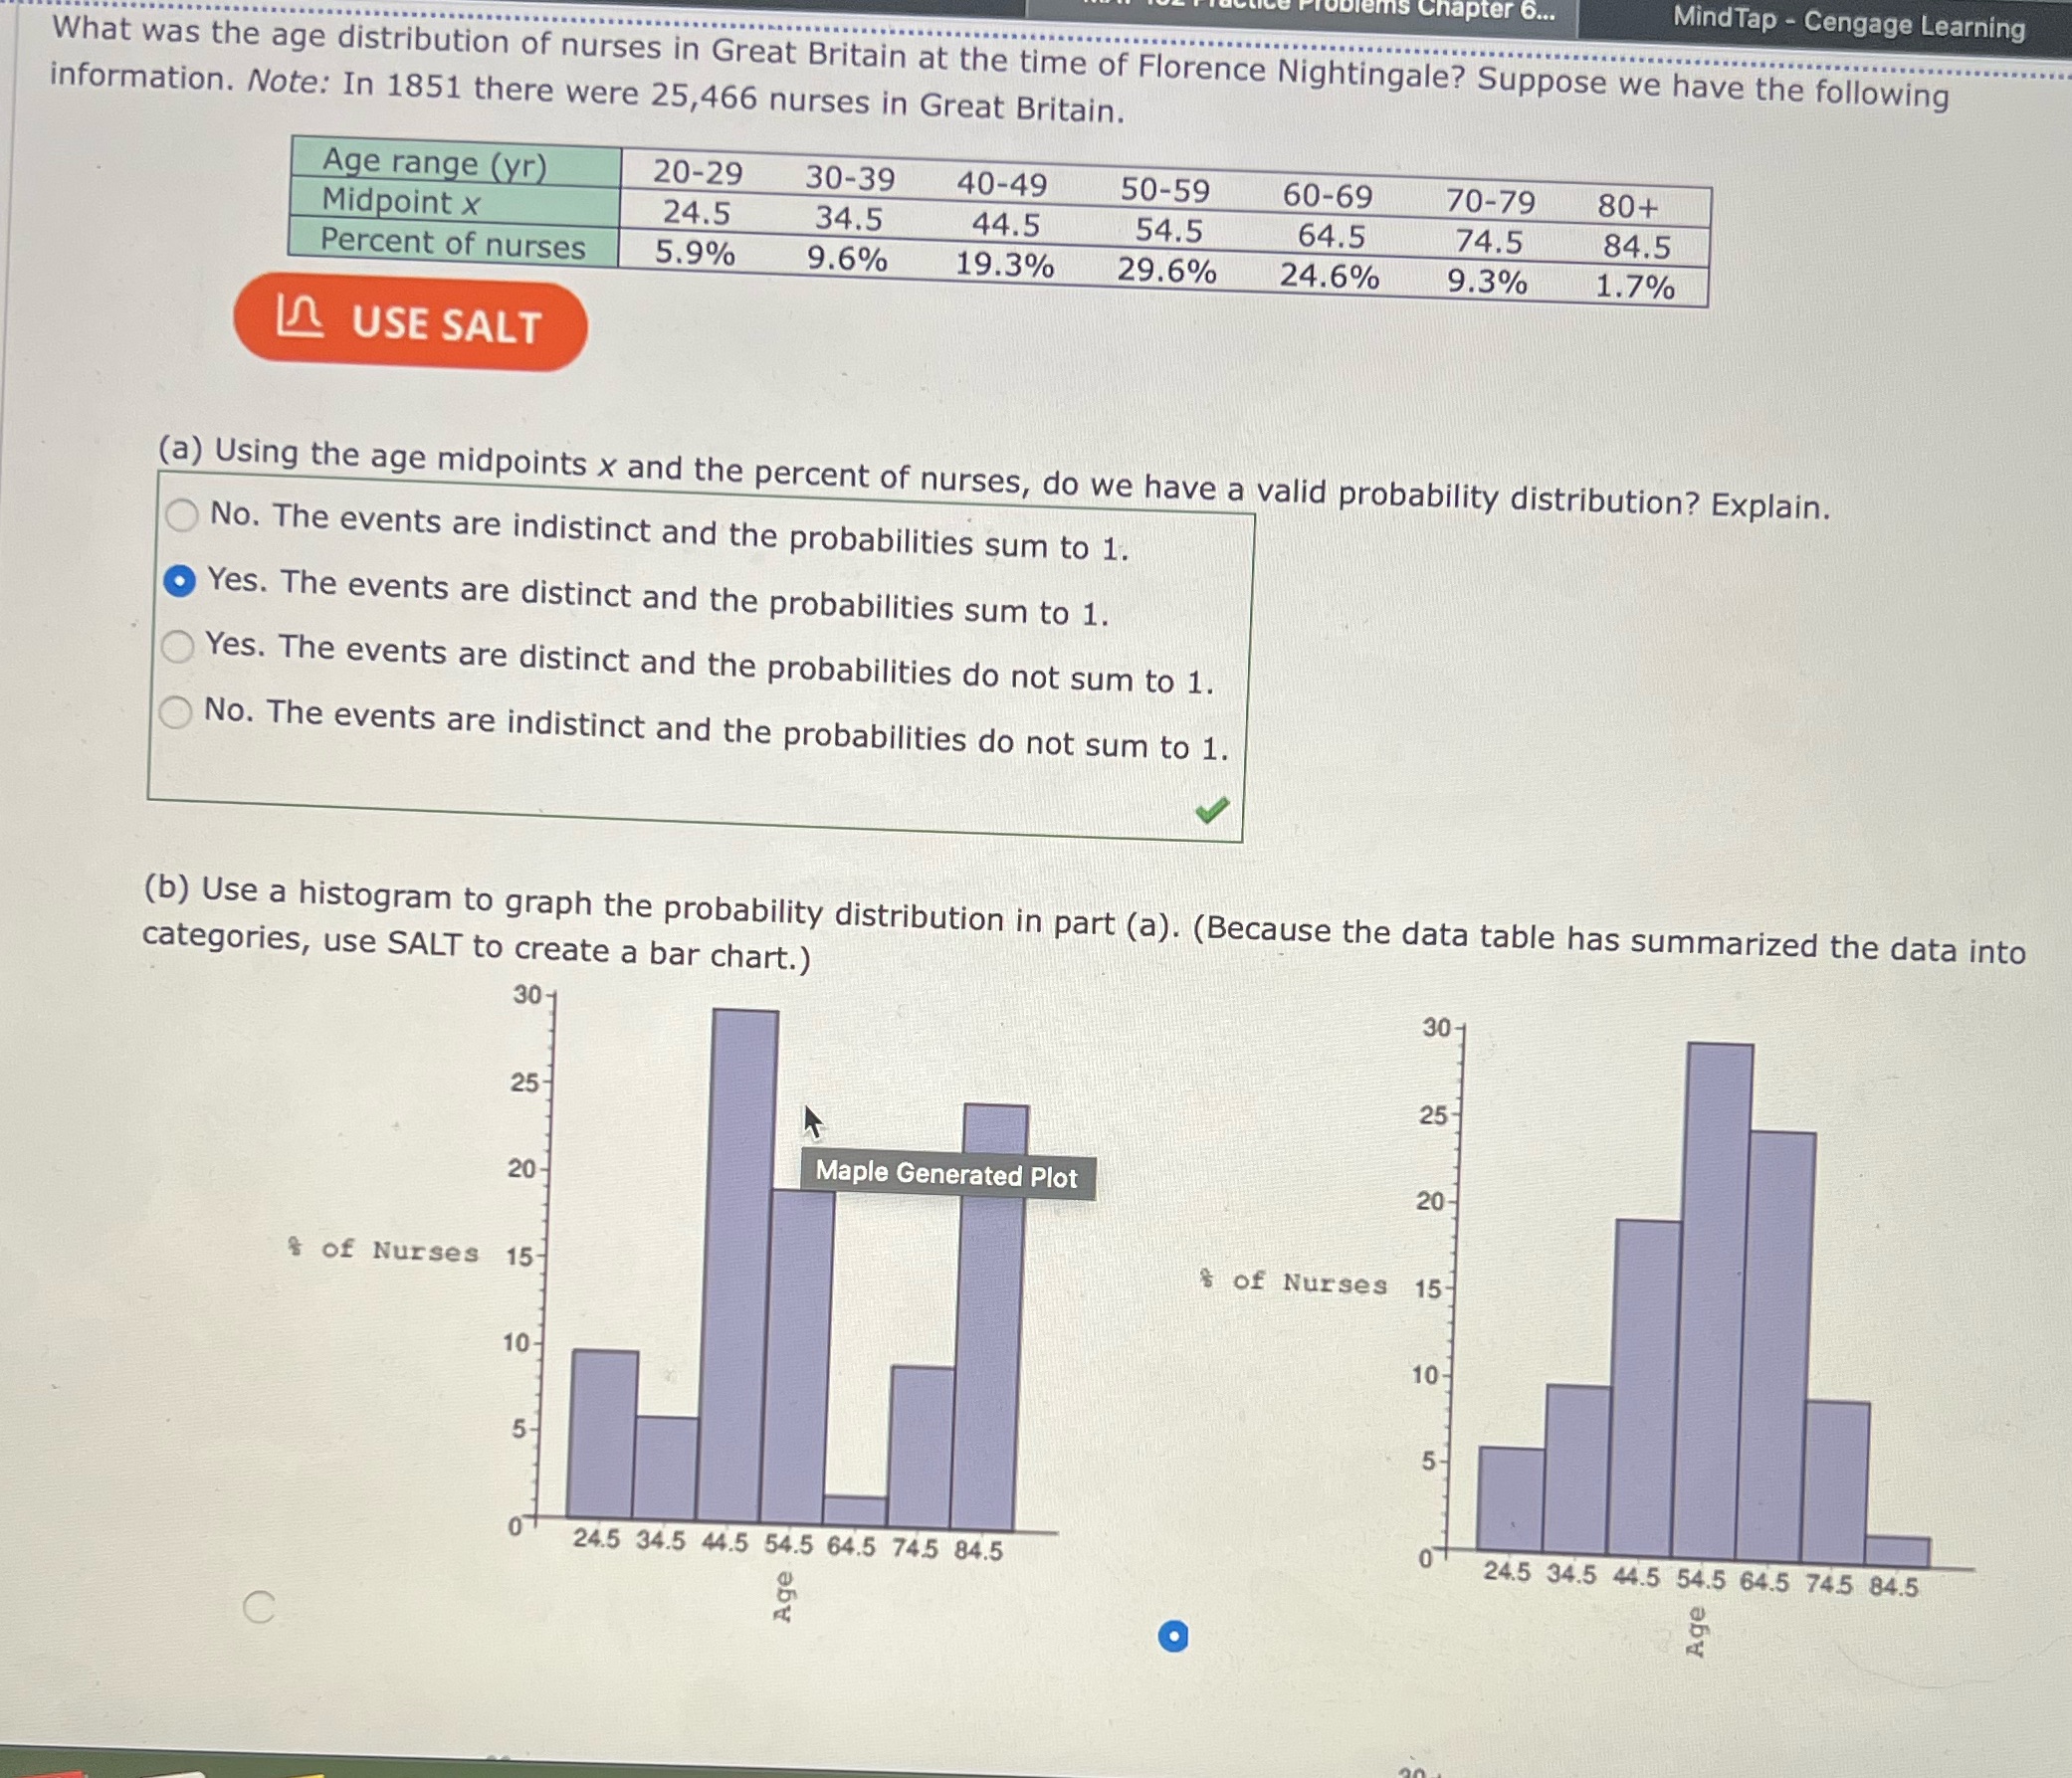
Chapter 6... Mind Tap - Cengage Learning What was the age distribution of nurses in Great Britain at the time of Florence Nightingale? Suppose we have the following information. Note: In 1851 there were 25,466 nurses in Great Britain. Age range (yr) 20-29 30-39 40-49 50-59 60-69 70-79 80+ Midpoint X 24.5 34.5 44.5 54.5 64.5 74.5 84.5 Percent of nurses 5.9% 9.6% 19.3% 29.6% 24.6% 9.3% 1.7% LA USE SALT (a) Using the age midpoints x and the percent of nurses, do we have a valid probability distribution? Explain. No. The events are indistinct and the probabilities sum to 1. Yes. The events are distinct and the probabilities sum to 1. Yes. The events are distinct and the probabilities do not sum to 1. No. The events are indistinct and the probabilities do not sum to 1. (b) Use a histogram to graph the probability distribution in part (a). (Because the data table has summarized the data into categories, use SALT to create a bar chart.) 30- 30- 25- 25- 20 Maple Generated Plot 20- $ of Nurses 15- $ of Nurses 15 10 10- of 24.5 34.5 44.5 54.5 64.5 745 84.5 24.5 34.5 44.5 54.5 64.5 74.5 84.5 Age C O
Step by Step Solution
There are 3 Steps involved in it

Get step-by-step solutions from verified subject matter experts