

Question: need perfect answer with correct explanation point Evaluate this image and complete the multiple choice inquiry: Chi-Square Test Chi-Square DF P-Value Pearson 28.851 0.000 Likelihood
need perfect answer with correct explanation point
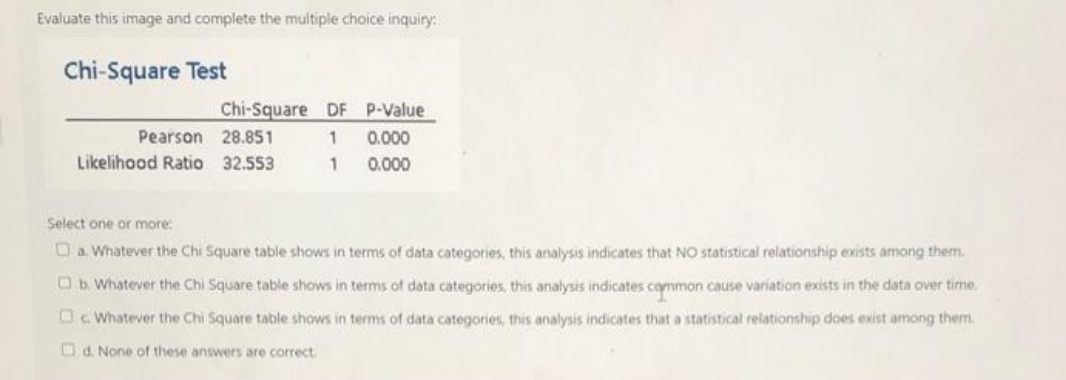
Evaluate this image and complete the multiple choice inquiry: Chi-Square Test Chi-Square DF P-Value Pearson 28.851 0.000 Likelihood Ratio 32.553 0.000 Select one or more: D a. Whatever the Chi Square table shows in terms of data categories, this analysis indicates that NO statistical relationship exists among them. b. Whatever the Chi Square table shows in terms of data categories, this analysis indicates common cause variation exists in the data over time () c. Whatever the Chi Square table shows in terms of data categories, this analysis indicates that a statistical relationship does exist among them. "d. None of these answers are correct
Step by Step Solution
There are 3 Steps involved in it

Get step-by-step solutions from verified subject matter experts